- China Trading Statistics
- Darvas Trading
- GMMA Breakout Behaviour
- Happy Easter Holiday
- Holiday Trade Management
- Managing Profitable Trades
- Measuring Returns
- News and Profits
- Placing the CBL Stop
- Recovery made in China
- Secrets of Gold
- The difference between trading
and investing - Trade Exit
- Trading Briefs
- Trading Halt
- Trading IPO's
- Trading Psychology - Getting Perspective
- Using a Private Index
- Using Effective ATR Stops
- Using Equivolume
Articles include:
Most traders continue to watch the DOW, but it is also increasingly important to watch the performance of the China market. The Shanghai Composite index is the benchmark. The strength of the China market provides a counterbalance to the weakness of the US economy. Traders can no longer afford to ignore what happens in China. Guppytraders has been actively following the China market for more than 4 years. We provide China market analysis to Mainland Chinese financial media in regular weekly columns. This includes a column in the Shanghai Security News - the equivalent of the Australian Financial Review.
The pattern of consolidation, accumulation and breakout behaviour in the China market provides an important template for the potential recovery patterns in our own market. Learn to recognise these and you have a powerful advantage in trading the recovery breakout.
The Shanghai Index has added a remarkable 40% since the low of October 2008. Other than this outstanding growth, the most important feature of the market is the way it points to the potential bottom pattern development in Western markets. Feeling the full brunt of the global financial crisis, many people outside naturally like to believe there is something unsustainable about the China recovery. After all, if our home market is so bad, how can the China market be so good?
The standard of China analysis in Australia is poor. We think Santa Clause must be Chinese because most Christmas gifts are made in China and we assume exports must be as significant to China as they are as imports to Australia. Exports add less than 2% to Chinese GDP. The remaining 6% to 8% of GDP growth is created by domestic Chinese consumption. China direct investment in Australia is around 30 billion dollars compared with 400 billion dollars in direct investment from America. Chart analysis provides a clearer picture of market reality.

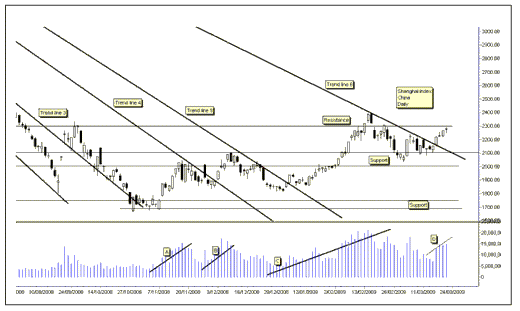
The pattern of chart behaviour in the Shanghai Index is a reflection of optimism. The long-term trend reversal and trend breakout has been defined by the pattern of six fan trend lines. The pattern starts with the 2008 January 15 high. The pattern has six fan trend lines. Each trend line acts as a resistance level, and then later as a support level. This is a pattern that signals a long-term change in the trend that often takes 5 to 8 months to fully develop.
The fan trend line 6 starts on 2008, January 15 and touches the high point of February 17 and the third high point on March 9. In recent weeks fan trend line 6 has been a strong resistance level. The retreats from this resistance level have tested and retested support between 2000 and 2100. Fan trend line 6 will cross the support level at 2000 in the first week of April.
A breakout above fan trend line 6 can be very powerful A breakout would move quickly towards to next strong resistance band between 2600 and 3000.
If the index is not able to move above fan trend line 6 then it will drop below support at 2000. This would retest the lower support band between 1750 and 1800. In this situation the market would return to a sideways trading consolidation band. This delays the up trend reversal, but it does not signal a continuation of the long-term downtrend. The consolidation period between 1750 and 2100 started in 2008 October and it has proved a strong area over the past 6 months.
The consolidation and potential for an uptrend breakout is also verified with the behaviour of trading volume. It has increased and this shows more people are confident and active in the market. The volume increases when there is a rally in the index. When the index falls the volume also falls. This shows that people are not selling when the index retreats.
The Guppy Multiple Moving Average (GMMA) relationships show developing long-term support for the trend. The long term GMMA is moving sideways and it has shown very little evidence of compression during the recent market retreat. This confirms investors are buyers in this market and they used the index retreat as a buying opportunity. Many traders are ready to join the market when the index moves above the value of fan trend line 6.