- China Trading Statistics
- Darvas Trading
- GMMA Breakout Behaviour
- Happy Easter Holiday
- Holiday Trade Management
- Managing Profitable Trades
- Measuring Returns
- News and Profits
- Placing the CBL Stop
- Recovery made in China
- Secrets of Gold
- The difference between trading
and investing - Trade Exit
- Trading Briefs
- Trading Halt
- Trading IPO's
- Trading Psychology - Getting Perspective
- Using a Private Index
- Using Effective ATR Stops
- Using Equivolume
Articles include:
Extract from the Asia and China edition of the monthly newsletter. Also in the monthly China Mandarin newsletter. Data provided by JustData's BodhiGold.
Understanding the historical performance of broad market behaviour provides a framework for some trading strategies. It is useful analysis for those who trade Exchange Traded Funds and other index linked securities. It is also useful for those who trade index sensitive stocks as index behaviour is broadly repeated in the individual stocks that make up the index. Traders of other stocks may use the broad market conditions as a guide to the need to tighten stop loss or protect profit points.
There are two measures we track in these notes. The first is the monthly average return. This is calculated by comparing the open to the close of each month. The results tell us if the market, on average, adds value during the month, or deducts value.
The second measure is average monthly volatility. This is obtained by comparing the average change between the low and the high for the month. This is always a positive figure, even in a falling month. It tells us how far the index has moved on average, between its extremes for the month. This captures the ranging activity. In a bullish month, this tells traders how much they could expect the move on the upside. In bearish months, this helps define the average limits of the downside move.
October is the worst month of the year. Right? In Hong Kong it is the third best performing month of the year. The worst months of the year are March and August where on average over the past 19 years the market has produced the largest loss of any month. Buy at the start of August and hold onto stock and there is a very good probability you will end up with a 1.38% loss or a 1.47% loss in March.
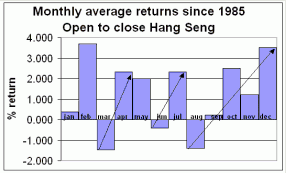
October performance is much better with an average 2.55% gain. This is part of a multi-month growth strategy. The market rises consistently starting in August and ending in December. The statistical market decline in November is an opportunity for traders to add to strong trend trades as the price closes temporally weaker.
Additional multi month strategies occur in February/March, and in June/July. Buying the lows of the month and selling the highs of the following month locks in a consistent rally return lasting 6 to 8 weeks. Trading after the Spring Festival provides a boost to the market and makes February the best performing month of the year. A good strategy is to buy stocks in January as other traders sell them in preparation for the Spring festival. This allows quick profits to be collected as the market rises after the Spring Festival period.
Monthly Average Returns - China Mainland
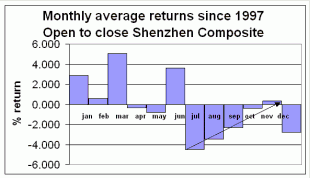
Preconceptions and assumptions are dangerous attributes in any market because they prevent us from really seeing what is there. There are two sets of assumptions at work in trading China markets. The first is that Shanghai and Shenzhen markets are closely linked and will deliver similar returns. These traders believe the two markets effectively work in tandem, in an informal single market where similar relationships are found in each market. Such beliefs lay the foundation for trading failure. There is a similarity in behaviour between the two markets, but they do not trade in tandem.In a 7 year average, July is the worst performing month in both Shanghai and Shenzhen. July shows a 4.9% fall in Shenzhen which is larger than the 3.8% July decline in Shanghai. The 7 year average shows a 4.5% return for March, which is the most outstandingly bullish month in Shanghai. The rise of 5% in Shenzhen is larger. Both these rises come after the market opens again after the extended Spring Festival holiday. It is important to note that this effect is not repeated after the extended mid-Autumn festival break.
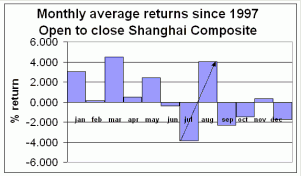
Once we look beyond these two months, the joint relationship between the two markets breaks down. The most successful market strategy in Shanghai is to buy near the July lows and sell as close as possible to the August highs. Follow this strategy in Shenzhen and you miss the long term trend that starts with the lows in July and ends with the high of November. This is suitable for longer term trend trades, although the final rise is much smaller than the two month July/August strategy in Shanghai.
The two markets do show similar behaviour. They are dominated by 6 to 8 week rallies. The February/March period in Shanghai is a good example of this behaviour. January is a strong month, but it is followed by a poorly performing February. Traders who buy near the lows of February are able to sell near the highs of March and collect a good short-term profit. After March, the market falls rapidly in April. Traders who buy near the lows of April can sell near the high in May.
These peaks and lows do not occur at the start and the end of the month. This diagram tells us that sometimes during April there is a low point, and that this is followed by a high point in May. This low and high may be separated by 4 to 8 weeks.

These two month relationships develop consistently in both markets. The diagram shows how they appear in each market. In both Shanghai and Shenzhen the market starts to rise in December and peaks in January. The Shanghai market has more two month rally trading combinations. It has a long three month trend starting in September and ending in November.
The Shenzhen market is different. It shows a long term market rally from July through to November. However, if you look back at the Average monthly return charts it is clear that this long term trend does not deliver very large gains. The best combination is the July/August rally in Shanghai and the December/January rise in both markets.

Information about the average performance for the month in each market helps traders to develop a comprehensive strategy for trading China markets. The diagram shows the best performing months. These are different from the combination months because here we look just at those months with positive returns. Using this analysis the Hong Kong market gives the best returns for the last three months of the year. In every month of the year, traders are able to reap rewards from the average performance of each market. This means mainland markets in January. Hong Kong in February, back to mainland for March and the Hong Kong for April. Based on average monthly performance, the trader is 'flat' or out of all markets in September.

This does not mean that one market is better than another. This strategy simply brings together the best possible exposure to the best performing months across each market. For those traders with a more global perspective, we show the best trading months for other Asian markets as well. Using this strategy, traders use September to trade the Singapore market. Most months traders have a choice of at least two markets which are performing well. In February and October it is just the Hong Kong market which provides the best average returns.
Monthly Average Volatility - Hong Kong
Investors may be interested in measures of monthly returns, but traders are attracted to volatility. Where there are big market moves there is an increased probability of profiting from the changes in price. The charts show the volatility range, but they do not show the direction of the price move.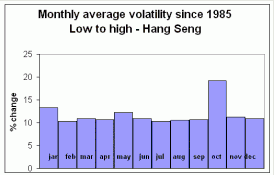
October is not the worst performing month in Hong Kong, however it is a month with the highest level of volatility. At 19.1% average difference between the low and the high for the month over the last 19 years this suggests October is a great month for traders. It confirms October can experience some heart stopping lows, but for those with clear trading discipline, this provides a good buying point for the subsequent rebound. On average, October ends on a positive note with a higher close.
The diagram shows the volatility range, but it does not show the direction of the price move. The market generally shows around 10% volatility. Despite the swings in average monthly performance, the volatility of the Hang Seng remains relatively stable.
Monthly Average Volatility - China Mainland
Hong Kong is an established market. The China mainland markets have been trading for a shorter period and many people assume there is a higher level of volatility. Again, this assumption is incorrect. These markets trend more strongly, but they do so with a lower level of volatility. The two mainland markets do not move in tandem when it comes to the best performing months, or combination of months. There are differences that make it more profitable to trade Shanghai in April than Shenzhen. The second assumption traders make about the mainland markets are that they deliver similar levels of volatility.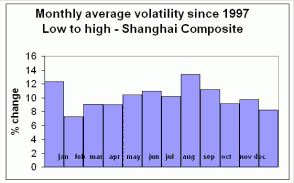
The Shanghai market has around 9% monthly volatility. August is the month with the largest average swing over the past 7 years, but it is only 10%. This is just above the average. This market is more stable than Hong Kong where the October volatility is 9% above the average.
There is a general small increase in monthly volatility from February through to August followed by a decline from August to December. The largest change in volatility is in January.
At 12%, Shenzhen does show a higher average level of volatility than either Hong Kong or Shanghai. This simply means that the average market move is larger than either of the other markets. Unlike Shanghai, the most volatile month for Shenzhen is June with an average change of 15.9% The level of volatility generally declines for the remainder of the year. It starts to lift again in January and remains stable until the June peak.
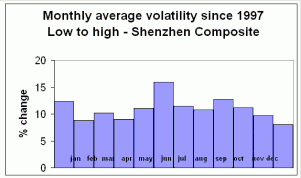
These measures should be put into a broader context. The average monthly volatility for Malaysia is 10%, for Singapore 8% and Australia 6%. Both Hong Kong and Shanghai are stable markets with steady swings. The Shenzhen market is a better market for traders with slightly larger monthly swings.