- China Trading Statistics
- Darvas Trading
- GMMA Breakout Behaviour
- Happy Easter Holiday
- Holiday Trade Management
- Managing Profitable Trades
- Measuring Returns
- News and Profits
- Placing the CBL Stop
- Recovery made in China
- Secrets of Gold
- The difference between trading
and investing - Trade Exit
- Trading Briefs
- Trading Halt
- Trading IPO's
- Trading Psychology - Getting Perspective
- Using a Private Index
- Using Effective ATR Stops
- Using Equivolume
Articles include:
When markets are forced to stop trading because of holidays, traders become concerned. An extended period of non-trading leaves open positions vulnerable to holiday events. A long weekend is bad enough in volatile markets. A four day trading break for Easter can be disastrous. On the other hand, some holidays seem to infuse the market with bullish enthusiasm, or with gloom. Some of these relationships are so well known in US markets that traders have a high probability of success if they buy in the week prior to St Patrick's day because the market closes higher for that week most of the time.
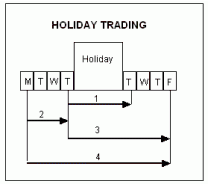
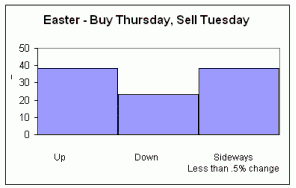
We are coming up to the extended Easter break, followed later by Anzac Day. Traders have four combinations in trading this period. The first, looks for an answer to the most basic holiday question: Should I close open positions before the holiday? The reverse of this question is to decide what happens if we buy on Thursday before Good Friday and sell on Tuesday after Easter Monday. Does the market tend to go up, or down?

Statistical analysis of our 13-year database provides a breakdown of the outcomes.
The second question concerns traders who are looking for a bullish bias in the week leading up to the start of the holiday. Is there an advantage in buying on Monday and selling at the close on the Thursday before Good Friday? If there is a strong statistical bullish bias then this provides a useful short-term index strategy, particularly if we already feel the market is in a bullish mood.
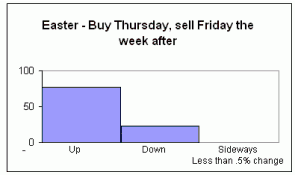
The third question is a variation of the second. Traders who buy on the last trading day before Christmas usually benefit from a Christmas rally in the week after Christmas. In some cases there may be advantages in buying just prior to the holiday and holding onto the trade until the end of the next week.
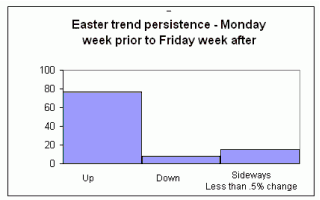
The final question considers the persistence of the trend. If the trend is up in the week prior to the holiday then what are the chances of this trend remaining in place in the week following the holiday? If we are confident that the trend continues most times then we can ignore any small dips in the up trend and enjoy our holidays.
The answers to these questions provide potential trading opportunities as well as a better idea of the best course of action to take if we are already holding open trades. Remember our analysis is based on the XAO All Ordinaries up until 2001, and then on the XJO, S&P ASX 200 for 2003. What happens in the broad market is not always the same as what happens with an individual stock. However the broad market provides a background for price action.


We start the analysis with the Easter holiday. Traders who buy on Thursday and sell on Tuesday face a 38% probability that the market will move by less than 0.5%. However there is a 38% probability that the market will rise over this period. The best rise in the past 12 years was 2% in 1999. Although there is a lower probability of the market falling over Easter, some falls can be quite severe. In 1997 the fall was 2.9%.
On balance, traders who already hold open positions going into Easter are unlikely to see major price shifts over the four-day break.
Do people get excited about Easter? If they do then we can expect to see a rise in the week prior to the Easter break. This turns out not to be a good strategy, with the market drifting sideways for 46% of the past 12 years. On the positive side, when not moving sideways, the market has risen 46% of the time. The best of these bullish rises was in 1995 with a 1.95% rise. It is unusual for the market to fall in this period with 1994 the only example. The fall was a heavy 2.6%. The market did fall slightly in four other years, but these falls were all less than 0.5% so we include these as a sideways week.

Traders who buy on Thursday prior to Easter and hold onto their stock for the following week get to ride a bullish trend. Over the past 12 years, the market has closed higher in the week following Easter 77% of the time. It has either moved up, or down. There are no sideways weeks following the Easter break. Traders who held stock prior to Easter have a good chance of selling out at a higher price by the end of the following week. These consistent high probability rises suggests that there are advantages for traders who buy on weakness prior to Easter with the intention of taking a quick profit in the following week.
The most bullish week delivered a 2.91% rise in 1999. This is almost as extreme as the 1997 fall of 2.81%.

The final question traders are interested in is the direction of the trend over this two-week period. The good news is that the trend does persist, and that it is bullish. Traders who purchased on the Monday prior to Easter and held onto stock until the Friday following Easter saw a bullish trend in 77% of years. Friday in 2003 was Anzac day, so we have used the Thursday close in these calculations. The best rise on this period was of 6.65% in 2000. In the 8% of years that fell, the worst year was 1997 with a 1.35% fall for the two-week period. The market moves sideways 15% of the time.
Traders who already hold stock going into the Easter week have a very high probability that the stock will continue with its pre-existing up trend and that it will finish higher in the week following Easter. A market rise in the week before Easter is followed by a continued market rise in the following week 89% of the time.
These statistical relationships deliver two messages. For traders it suggests that it is a useful strategy to buy on the Thursday prior to Easter and sell on the Friday following Easter to take advantage of the high probability trend rise. For investors, or traders who already hold open positions with bullish trends going into the week prior to Easter it suggests that there is no need to sell in anticipation of a decline following the Easter break.
In compiling these statistics and relationships we use the old All Ordinaries for most of the period, and then the new S&P/ASX 200 after January 2002. Trading statistics are a guide to how the market has performed, on average, over a selected period. They provide an indication of how the market may perform in the future and they also provide a reference point against which we can observe changes in market behaviour.
| SUBJECT SUMMARY - MARKET STATISTICS These statistics are compiled from an 13 year data base of the All Ordinaries commencing in January 1990. They include intra-month results where each month is assessed on a higher or lower close than its open. Inter-month analysis compares the relative performance of each month with the previous month or group of months. This tells us if this month closes higher than the previous month. It also gives us information about the potential for months to move as part of a multi-month trend. These statistics are helpful in establishing a general view of the market and its average behaviour. Traders use this as a benchmark to assess current behaviour. |