- China Trading Statistics
- Darvas Trading
- GMMA Breakout Behaviour
- Happy Easter Holiday
- Holiday Trade Management
- Managing Profitable Trades
- Measuring Returns
- News and Profits
- Placing the CBL Stop
- Recovery made in China
- Secrets of Gold
- The difference between trading
and investing - Trade Exit
- Trading Briefs
- Trading Halt
- Trading IPO's
- Trading Psychology - Getting Perspective
- Using a Private Index
- Using Effective ATR Stops
- Using Equivolume
Articles include:
Traders believe that volume tells us something important about price and trends. We believe that significant moves in volume indicate trending activity and point the way to major changes in the direction of the trend. Previous investigation has established that volume does not help us understand trending activity or identify trend changes. Volume peaks are not always associated with significant trend changes, or significant price activity in stocks with consistently high volume.
Moving from broad volume relationships to tradeable detail is a more difficult task. The Equivolume display attempts to do this by making volume an equal partner with price. The mechanics of the forced marriage are complex so most traders concentrate on the outcome quickly displayed on their computer screen.
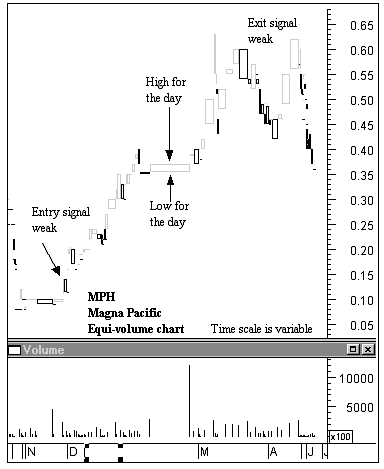
The Equivolume display uses boxes of various sizes. The top line of the box is the high for the day, and the bottom line the low. The open and the close are excluded from the standard display. The candlestick application of this technique uses the body to show the open and close, and two wicks to show the high and the low and is a more useful application of this particular plot. Knowing where the close is placed in relation to the high or low is particularly useful because it tells us where the bulk of the crowd is placed.

The Equivolume boxes have variable width. The width of the box represents the volume traded for the day and here lies a small but dangerous trap. The width of each Equivolume box is based on a per centage of the total volume displayed on the entire chart. If the chart displays 100 days with a combined total volume of 100,000, then the size of each Equivolume box is determined by the normalised volume value. This divides the actual volume for the day by 100,000 in this example. The width of each box is a percentage of this 100,000.
On the next day the total volume displayed changes to perhaps 120,000, but only 100 days are shown. The oldest day is dropped off and the newest day is added to the display to keep the display length consistent at 100 days. This changes the percentage relationships, and alters the width of pre-existing boxes. No longer is the chart directly comparable to yesterday's chart, or the chart plotted three weeks ago. The problem remains even when the chart starting date remains fixed. Now the total volume is 120,000 but 101 days are shown.
The changing relationships are not a problem with Equivolume chart displays if we use them to explore the changes in demand and supply. The dynamic alteration is an advantage because we more accurately place today's price and volume relationships in a context of previous relationships. What was once a major event may, in comparison, shrink to relative unimportance as the drama of market action unfolds.
Traders turn to Equivolume displays to ferret out a small range of specific relationships. Short and wide boxes show small changes in price, but very heavy volume. These squat large boxes usually appear at turning points. At the bottom of a downtrend these show steady accumulation of shares. Experienced investors are buying quality at discount prices. Sometimes we infer informed traders are buying ahead of an important news announcement. These squat boxes sometimes hide those who want to get many shares without disturbing the market too much. Not every fat squat box is a sign of inside, or informed trading, but the possibility is always there.
At the top of a trend, the same pattern of squat boxes shows a steady distribution of shares. Traders and investors are slowly selling, or unwinding, their positions to people who are less informed. On a bar chart this shows up as a resistance level. The addition of volume information supplies extra information about the nature of the resistance.
When an Equivolume display is used with MPH it is difficult to identify any distinctive signals for the entry or exit points. Traders working with Equivolume should ensure that the display does give reliable signals so the reality of the market matches the theory. We could have used a better example but this is misleading. Not all indicators work well with all stocks, or in our market. Just because it is included in your software does not mean you have to use it.
Equivolume plots were developed by Richard Arms and detailed in Volume Cycles In the Stock Market. The research was based on American markets and may be of less relevance and application to Australian markets. Please refer to our initial discussion in these articles on the difference between quote and order driven markets and the impact this has on volume behaviour. He notes 'power boxes' where both height and width increase substantially. When these boxes appear above a resistance level they signal a well sustained breakout. In contrast, thin boxes starved of volume suggest these breakouts are poorly supported. This is a significant way to verify other charting signals, such as the breakout from an upsloping triangle. Volume feeds the market, and Equivolume plots provide a useful way to capture the relationship in a single chart display.
We tend to ignore the impact of volume in many of the newsletter notes, unless it is a significant factor in position sizing. Volume has a much larger role to play in many trading approaches. It is a very useful way of understanding the balance of trading. In this short trade discussion, Geoff Stevens, shows how he used an equivolume indicator to provide additional information about the management of a trade.

Our objective in bringing you these notes is to give readers an opportunity to understand how other traders approach the market. You may agree or disagree with their approach. That is not important. What is important is to use these notes as an opportunity to learn more about particular successful trading approaches. The market is always difficult and we must respect, and where possible, learn those who make successful trades.
In using technical analysis we are deciding to study the output of emotional responses Greed, fear and fundamentals all coming together in the form of a daily/weekly chart, By using many of the charting techniques taught in the newsletter we have learnt the importance of not only choosing an appropriate stock to buy - based on technical analysis - but more importantly of have a trading strategy to 'manage the trade' A charting indicator often overlooked brings together the importance of Volume and Price in the form of a equivolume chart.

Using this technique allows the "depth" of the price action to be more equally recognized than the simple bar chart. This gives the chartist a greater perception of Support and Resistance levels when compared to simply 'eyeballing' a price bar chart. Allowing entry and exit and levels to be more easily fine tuned.
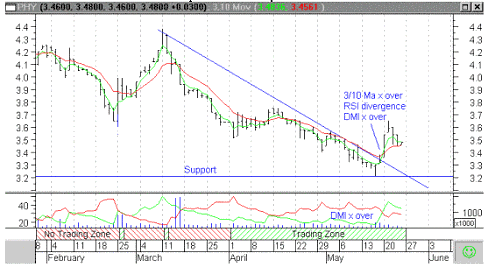
The Pacific Hydro charts illustrates how this is applied when it broke out of a long term downtrend. This was supported by the cross over of the 3 and 10 day moving averages. There was also an MACD crossover and a classic class A triple RSI divergence. Other indicators also flashed a signal, including a crossing of the +DMI and - DMI . These all confirmed a possible change in market sentiment as the stock opened above the trend line. Market depth indicated lack of sellers and good buyer depth. The stock was entered at $3.41.
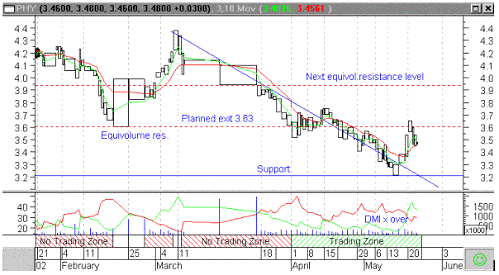
Using the above example of Equivolume, the significant resistance level was plotted at $3.60. followed by another significant resistance at $3.94. This was the bottom of the trading range on particularly high volume days traders allow a small overrun to the upside. On this basis an immediate sell order is placed at $3.63. The next day the stock reached an intraday high of $3.65 which meant the order was filled with a total return was a 6% overnight profit.