- China Trading Statistics
- Darvas Trading
- GMMA Breakout Behaviour
- Happy Easter Holiday
- Holiday Trade Management
- Managing Profitable Trades
- Measuring Returns
- News and Profits
- Placing the CBL Stop
- Recovery made in China
- Secrets of Gold
- The difference between trading
and investing - Trade Exit
- Trading Briefs
- Trading Halt
- Trading IPO's
- Trading Psychology - Getting Perspective
- Using a Private Index
- Using Effective ATR Stops
- Using Equivolume
Articles include:
Who reads the software manual? Most people do not and, as a result, they miss out on all sorts of useful information. I am no exception, so I discover many useful features by 'accident'. The new BodhiGold is a gold mine of useful features and in this article we will highlight a few of them. Now you can adjust Bodhi data to suit your particular requirements in terms of including splits, taking into account dividends or creating continuous futures contracts. It's all about choice. Most of us simply use the default settings and plan to fine tune these later. Unfortunately 'later' never seems to arrive.
Market prices are subjected to many external factors which affect the price traded. These are lumped together under the term 'reconstructions'. The most common of these is the ex-dividend day. A stock trading at $1.00 with a $0.10 dividend will, in theory, trade at $0.90 once it goes ex-dividend. Should we include this traded price, or should we adjust the value upwards? When a stock pays dividend, it adds value to the stockholders, so shouldn't we add this to the price chart as well? This is done in the ASX accumulation indexes.
I have a basic belief about data and it is this. The price data I get from my data supplier today should show the exact open, high, low, close prices as physically traded in the market. I do not want an estimated price including dividend, or an estimated price including capital return. Later I may choose to export the data to a spreadsheet and make some adjustments for other analytical purposes. However, until I make that decision, I need to be absolutely certain that my original data accurately records the actual traded prices of the stock today.
-
BodhiGold classifies all reconstructions as either distribution or structural. Events that are classed as distribution include:
- Rights issues.
- Non-renounceable rights.
- Scrip issues i.e. extra free shares.
- Return of capital.
- Dividends.
All of these events have a theoretical impact on price which can be calculated. A share trading at $1.00 with a $0.10 cum dividend has a theoretical value of $1.10. However, the market may trade at a different price because people see the dividend as evidence of extra value in the stock. The traded price may be $1.15. The theoretical impact of a return of capital can be calculated, but this value may at times not be equal to the actual traded price of the stock. Rights issues may dilute the stock, but the theoretical impact is not always the actual impact.
I do not wish to include these theoretical adjustments, so I turn off these features in BodhiGold.
Structural events are those where there is a physical change in the value of the share, independent of any trading activity. This happens when there is a share split or consolidation. In a 1 for 4 consolidation, the physical number of shares you owned before the split - say 400 - will be reduced to 100.
On the day before the consolidation shares traded at $1.00, so the value of your 400 shares was $400. On the day after the split, the total value of your $400 shares remains essentially the same, but the number of shares you now own has been reduced to 100. This means the new structurally adjusted price is $4.00 per share ($4.00 x 100 = $400).
I need to include these adjustments to avoid the price chart gapping as a result of unadjusted data. This structural adjustment ensures data continuity between historical prices and today's price, and future prices. To include these adjustments automatically, I select Structural in the Events menu.
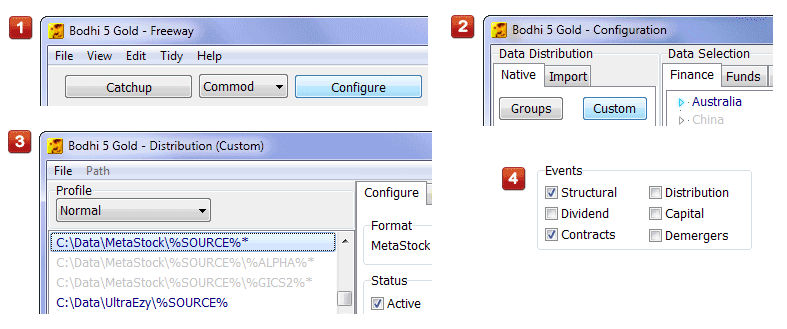
BodhiGold gives you the ability to turn-off all/any adjustments on an individual directory. Users have the choice of having some directories adjusted and some unadjusted.
There are two other features I want to include in my data. The first is related to the futures and commodity data. Selecting Contracts in the Events menu ensures that continuous contract futures charts can be easily constructed.
The second feature relates to no trade days, and by extension, to padded data. Consistent with my requirement for accurate as-traded data, I do not want to have padded data. Padded data automatically repeats yesterday's bar when no trading has taken place today. This situation occurs when the market is closed for holidays on what would otherwise be a normal trading day. Padded data shows a price bar for Good Friday and Easter Monday because the market is normally open Fridays and Mondays.
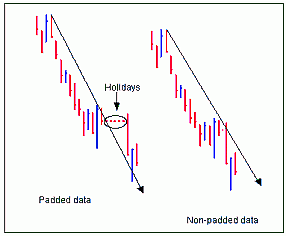
I do not believe the use of padded data can be justified, although for certain types of trading techniques based on calendar days, padded data is essential.
I choose to turn off padded data. This is achieved using one of the hidden features of BodhiGold. First click Configure and bring up the Configuration screen. Then click the Custom button to display the Distribution screen. Select the directory from the list (active directories are blue) then change the Padded option to None.
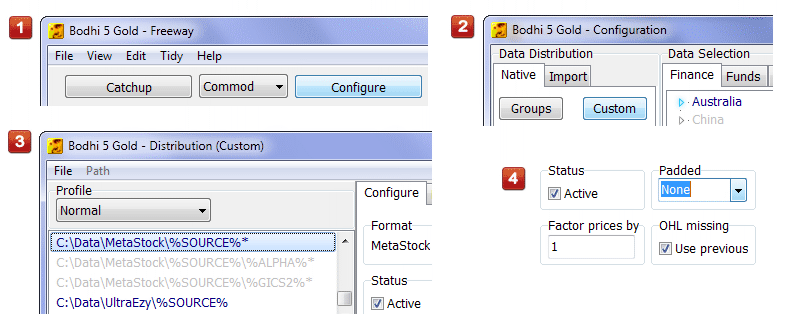
Padded data is different from a no-trade day. A no-trade day is when the stock has not traded because buyers and sellers cannot agree on the price. So what is the value of the stock on that day? This is an important philosophical question with three answers:
- The value is the same as yesterday's close, so we show yesterday's close on the no-trade day.
- The value is zero.
- The value is zero, so therefore we do not show that trading day.
Most often the answer you select is the default setting provided by the software. The answer you should select depends on your view of price and price activity. We have written about these differences before and we will not repeat the detailed arguments here again. BodhiGold gives you the choice of how you want to handle no-trade days. We choose to use the close of the previous day when a no trade day appears.
(My views on padded data and no trade days are ably misrepresented on some web sites and despite requests, the inaccurate statements have not been removed. A full discussion of these issues is contained in my March 2003 newsletters).
I download many markets and market segments. I tend to fiddle with my data requirements with the result that I may need to reset dates for downloads and exports. This used to be an involved process, but a new feature on BodhiGold makes it possible to reset all active files to a single received or updated date.
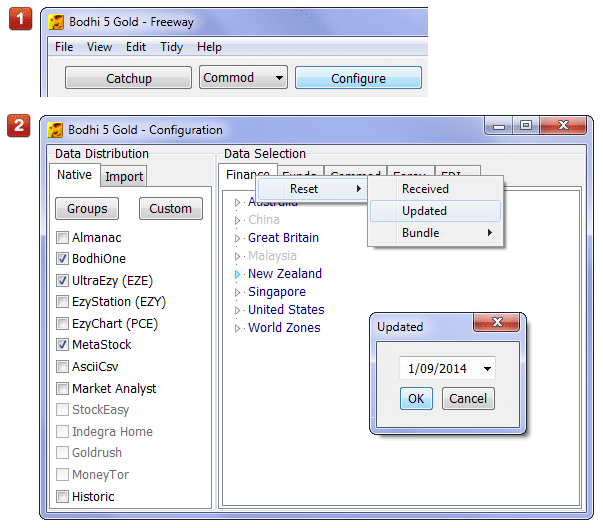
It starts with the configure button. This time right click on the Finance tab in the Data Selection menu. A menu will appear, choose Reset > Updated. The Updated form allows you to set a single export date for all active data markets that you subscribe to. This means I can set a common export date for all of my markets - Australia, Singapore, Malaysia, Hong Kong, USA, China etc in a single step without having to open each market individually.
Finally, here is an answer to a question we often see on the web. What stocks are included in each sector of the S&P ASX sub indices? BodhiGold gives you an easy way to answer this question. Start by selecting File, then Search to bring up a Search menu.
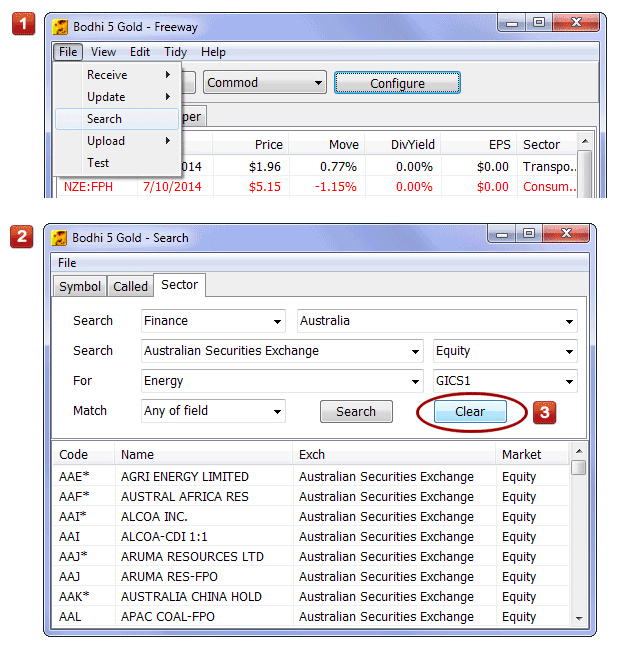
Click the Sector tab, and then select the country, market, and security type you wish to search. Then specify GICS1. There are many different choices available. Select the sub-index and click search. The full results will appear in the lower half of the screen. There is one important step to remember. You must clear the results of a search before you can start a new search.
BodhiGold is a gold-mine of features. They are all revealed in the manual, so it pays to fossick through this for more gold.