- China Trading Statistics
- Darvas Trading
- GMMA Breakout Behaviour
- Happy Easter Holiday
- Holiday Trade Management
- Managing Profitable Trades
- Measuring Returns
- News and Profits
- Placing the CBL Stop
- Recovery made in China
- Secrets of Gold
- The difference between trading
and investing - Trade Exit
- Trading Briefs
- Trading Halt
- Trading IPO's
- Trading Psychology - Getting Perspective
- Using a Private Index
- Using Effective ATR Stops
- Using Equivolume
Articles include:
One of the most satisfying and least time consuming tasks for traders is managing a profitable trade. The two notional case study trades are examples of this satisfaction. Checking the charts takes just a few seconds. You can take a few extra seconds to calculate ongoing profits, and these are included in the updated case study spreadsheet report at the end of the newsletter. They might not always be astounding, but they are profits.
A more comprehensive look at each open trade starts with a brief reminder of the trade plan. This is to remind ourselves of our original objectives, and to also establish if there is a need to modify or adjust the plan. Some trades develop into different trades after we have entered them. A trend trade based on a straight edge trend line may develop into a trade that is more effectively defined with a parabolic trend line. If this happens the trader must modify the trading plan to take into account the new devolvement.
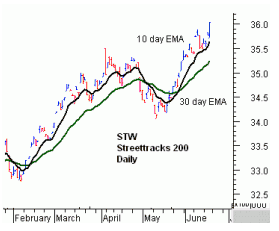
We start with the notional case study trade using the Exchange Traded Fund, STW. The trade plan is:

- Enter the trade when the 10-day moving average crossed above the 30 day moving average.
- Exit the trade when the 10-day moving average crosses below the 30 day moving average.
- Objective: It is essentially a trend trading approach and is designed to capture trends lasting weeks, months, or even years. It does not assume that market will always go up. It recognises that losses have a significant impact on profit growth and capital preservation. It also recognises that most people are not suited to the demands of frequent trading. The primary advantage of this approach is the way it removes the need to identify individual stocks. It also provides a way for the trader to patriciate in the broad market behaviour.
The 10 and 30 day moving average combination is a simple, robust and effective way of defining the trend in the XJO. The ETF allows the trader to use the same method to trade the broad behaviour of the market. The trend signals observed on the XJO chart are used as a trigger to execute the trading strategy in the Index fund. Active management means that returns can exceed those available from a buy and hold approach.
The STW chart has not triggered any of the planned exit conditions, so the trade remains open.
The notional case study trade with BAX is more interesting. The trade objectives are to ride the underlying trend. The analysis starts with the Guppy Multiple Moving Average. We start with the long-term group of averages. They are well separated, suggesting that investors continue to support this stock.

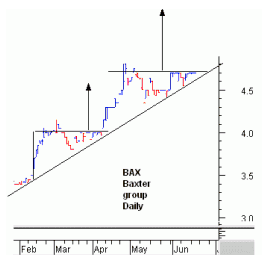
The characteristic behaviour of the stock continues. Prices rise from the trend line quite quickly, and then they drop back. This is followed by a sideways movement that carries prices back to the trend line. This is followed by another quick rise, small retreat and sideways drift. Although not part of the original trading plan, the consistent repetition of this pattern can be included in the developing trade management plan.
The upward sloping triangle confirms the bullish nature of the underlying trend. It sets a short-term target around $5.00. This pattern is a repeat of a similar pattern that developed in February through March. These patterns are part of the character of the BAX trend. They do provide short-term trading targets, but as this is a longer-term trend trade, we note this chart pattern only with passing interest. It confirms bullish strength and it is not part of this trading plan to trade this breakout.
This pattern of behaviour also allays concerns about the apparently static nature of BAX trading activity. There has been little price movement with BAX, with the price firmly stuck at $4.70 over several days. The resistance level has been solid and consistent. Short-term traders watch this pattern development with concern because of the low trading activity. In a bullish upward sloping triangle they expect to see a steady increase in trading and days with a good trading range that bounce off the trend lines and tackle the resistance level. This is a trend trade so we need to avoid being distracted by the factors that are relevant to other types of trading. The development of the triangle is a bullish feature. It confirms the underlying trend. The development of the pattern is a consistent feature of the character of the BAX trend. As such, it also confirms the strength of the underlying trend. All of these factors confirm that the underlying trend is intact and that there is no call for action. The case study BAX trade remains open.
SUBJECT SUMMARY - TRADE MANAGEMENT Stocks failing to develop as expected need to be closely examined to verify momentum. Sometimes traders may decide to take a smaller than anticipated profit, while at other times much greater profits are available. Trade management of open positions is important. But it is also important to avoid the lure of greed. Chase extra profits only if the charts support this. |