- Active Investing - what is it?
- All Weather Trading Plan using Complex Theory (Parts 1 - 4)
- Asset Management (Parts 1 - 4)
- Back Testing
- Breaking out from consolidation
- Breakout trading in all market conditions
- Charting in a Nutshell
- Children of the Bear
- Fibonacci and the Golden Ratio
- Going Public
- Hull Moving Average
- MACD Breakout Trading (Parts 1 - 2)
- Making decisions with a Simple Moving Average
- Probability: do you have the stomach for it?
- Profit Taking
- Relative Strength
- Record Keeping
- Risky Business
- Short Selling
- Social Media Bubble
- Switching Gears
- Rate of Return indicator
- Time and Money
- Tools of the Trade
- Trade Warrants (Parts 1 - 4)
- Trading without spending money
- Trendlines
- Triangles
- GMMA's on Weekly Charts
- Writing Custom Indicators
Articles include:
This article is based on the course notes from Alan Hull's forthcoming weekend course to be held in August 2004. Simon Sherwood and Alan will be spending an afternoon programming custom MetaStock formulas to perform market searches and then examining the results.
'Price/Volume Breakout' Searches
'Price/Volume Breakout' searches can be performed on either a daily or weekly basis where daily searches would be the most commonplace. The following chart shows a sharply rising share price accompanied by a sharp rise in volume. Imagine if you owned a widget store and you raised the price of widgets by 10% and then sales increased by 100%. Retailers would say this is highly unlikely but it is a regular occurrence in the stockmarket.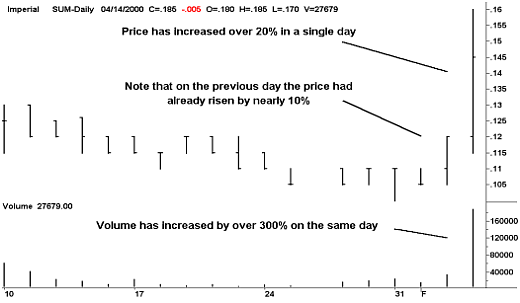
The above chart pattern indicates positive market sentiment and is commonly referred to as a 'Price/Volume Breakout'. Charting programs can locate this type of pattern using automated search routines that will save the trader hours of manual scanning.
Although charting programs have this search capability; it is left to the user to set the criteria for the search. But in addition to searching for sharp increases in both price and volume, it is also necessary to filter out shares that move rapidly because of low liquidity. In other words we don't want to detect a 1 cent share that has jumped to 2 cents in value because of several relatively small purchases.
This is done by checking 'Money Flow' which is calculated by multiplying the volume by the median price of the same period, ie. Volume x [(high+low)/2].
The following search criteria should return a handful of trading opportunities for each trading period. But as market conditions change over time, the search criteria should be adjusted accordingly. The following settings can be used for both daily and weekly searches. Weekly searches should be done at the end of the week, ie. after Fridays close. Of course it is highly unlikely that the following criteria will pickup any Blue Chip shares. Which is a good thing because 'Price/Volume Breakout' searches are designed to pickup only speculative shares.
- Price increase of 10% or more over the previous days closing price.
- Volume increase of 100% or more over the previous 10 day average.
- Daily Money-Flow of $250,000 (Weekly Money-Flow of $500,000)
The following chart shows a 'Price/Volume Breakout' Indicator triggering an alert when price activity increases by at least 15% in a single day. (Note the horizontal bar set at 15)
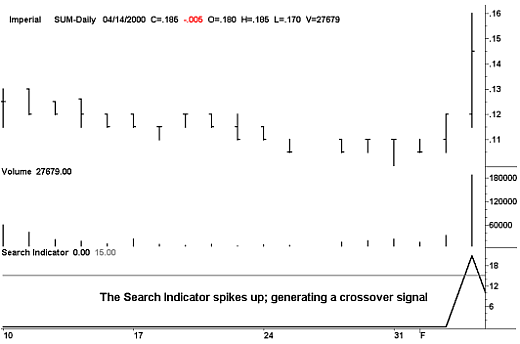
If the criteria are set lower then a larger number of possibilities will be found and less possibilities if the criteria is set higher. After conducting a daily or weekly search the trader will have a short list of possibilities that must be examined individually.
Search formulas for Metastock (Volume units must be given in 100s).
| colA = VOLUME*CLOSE | colC = Ref(mov(VOLUME,10,S),-1) |
| colB = VOLUME/2 | colD = Ref(CLOSE,-1)*1.1 |
| Filter colA>=2500 AND colB>=colC AND CLOSE&=colD | |
The 'Price/Volume Breakout' search using MetaStock
To setup a search in MetaStock, we use the 'Explorer'. The Explorer can be accessed from the 'binoculars' icon on the toolbar as follows (there is also a keyboard shortcut):
This brings up the main Explorer dialog box:
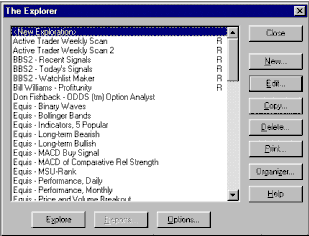
From here, we will click on the 'New' button to create a new exploration, which then brings up the Exploration Editor box:
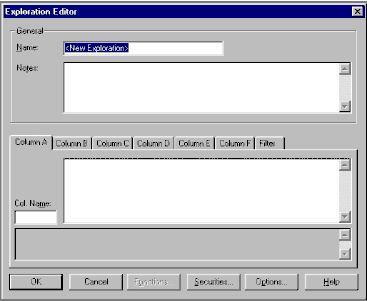
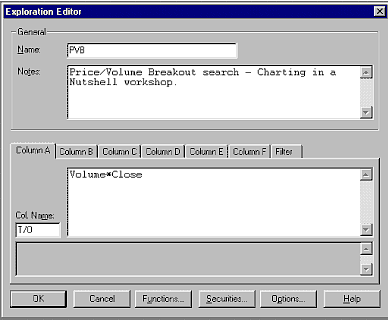
We can type in a name for the search, in this case 'Price Volume Breakout' and add some notes if required. The columns A to F can be best thought of as variable holders. Each one can be equal to something like a closing price or volume, or a combination of both. Remember the Explorer uses the MetaStock Formula language the same as in the Indicator Builder and Experts.
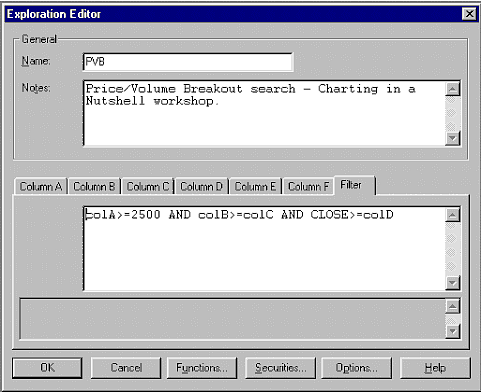
The 'Filter' column is where we give MetaStock the criteria of what it is to sift out, ie only show us stocks that meet the specified criteria, we don't want to see anything else!
For the 'PVB' search (Price/Volume Breakout), we are going to use the following values:
- Volume
- The Closing Price
- Yesterdays Closing Price
- Yesterdays value of the 10 period Simple Moving Average of Volume
- Turnover
In the following Columns:
- Column A = Volume * Close Turnover
- Column B = Volume/2
- Column C = ref(mov(Volume,10,s),-1) Yesterday's 10 period SMA of Volume
- Column D = ref(Close,-1)*1.1 Yesterdays close plus 10%
You can add a 'Col.Name' as well to identify the columns in the report that will be generated once you have run the exploration. Click on each 'tab' and enter the relevant data so the 'Editor' will look something like this:
The last thing we have to do is tell the Explorer what to 'filter' out. For the PVB search, we would want:
- Column A >= 2500 as long as our Volume has been scaled down by a factor of 100
- Column B >= Column C
- Close >= Column D
Any share that does not meet that criteria, we do no want to see, so the Filter will filter it out.
Now, our 'Filter' tab will look like this:
Now all we have to do is select the shares we want to Explore and the jobs done.
The key factor for employing market searches successfully is to always work from a foundation of need. Success is defined as the ability to take profits from the market and taking profits from the market depends on our ability to interpret price activity, not our ability to use computers nor the price we pay for our software. Computers are a 'Tool of the Trade' and are there to solve our problems and meet our needs. They are a means to an end... not an end within themselves.