- Active Investing - what is it?
- All Weather Trading Plan using Complex Theory (Parts 1 - 4)
- Asset Management (Parts 1 - 4)
- Back Testing
- Breaking out from consolidation
- Breakout trading in all market conditions
- Charting in a Nutshell
- Children of the Bear
- Fibonacci and the Golden Ratio
- Going Public
- Hull Moving Average
- MACD Breakout Trading (Parts 1 - 2)
- Making decisions with a Simple Moving Average
- Probability: do you have the stomach for it?
- Profit Taking
- Relative Strength
- Record Keeping
- Risky Business
- Short Selling
- Social Media Bubble
- Switching Gears
- Rate of Return indicator
- Time and Money
- Tools of the Trade
- Trade Warrants (Parts 1 - 4)
- Trading without spending money
- Trendlines
- Triangles
- GMMA's on Weekly Charts
- Writing Custom Indicators
Articles include:
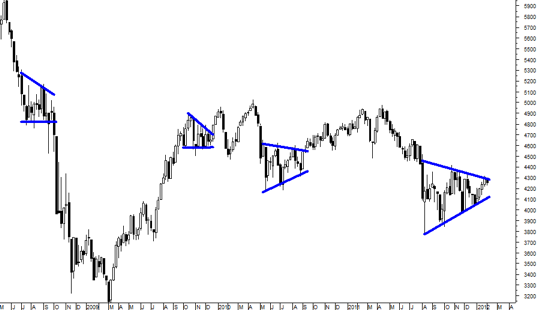
Markets consolidate regularly, meaning they often move sideways. These periods are a natural part of a market's life cycle. Unfortunately they are also a natural enemy for traders and investors. This is because it can be difficult to profit when the market isn't going anywhere. The following chart shows the ASX 200 index with several periods of consolidation highlighted between converging trend lines.
Luckily markets don't consolidate forever. I'll explain why in this article, and I'll also show how to use periods of consolidation to your advantage - turning a dull pause into a potential opportunity.

Figure 1 - ASX200 Index with periods of consolidation highlighted (weekly chart)
The reason markets consolidate and then rally is due to a dynamic swing in the behaviour of market participants. I'll explain using a humble $50 note.
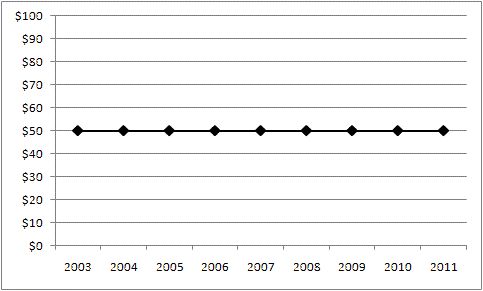
Would you purchase a $50 note for $60? I'm thinking that you probably wouldn't. Nor would you sell one for $40. This is because there is general agreement about the value of a $50 note - it's worth $50 today and $50 next week. So we really can't trade them and, therefore there is no market for them. The next chart shows what a price chart for $50 notes would look like - rather boring, isn't it. This is perfect consolidation, and it represents agreement on value.

Figure 2 - Imaginary price chart of a fifty dollar note
The opposite of this is widespread disagreement about the value of something. For this I want you to imagine a completely fictitious company called iWidgets. If this company lists on the stock market many traders and investors would immediately assess the possibilities and the potential risks for the company. This would probably cause disagreement amongst investors about the value of the company which in turn enables trading to take place. The share price of iWidgets would begin to rise or fall over time. You can see how financial markets thrive on disagreement.
In reality markets are dynamic which means they swing between the two states. When a market moves towards a point of agreement it probably won't reach complete agreement or that would mean the market would cease to exist. Instead, markets swing back the other way towards disagreement and a rally follows.
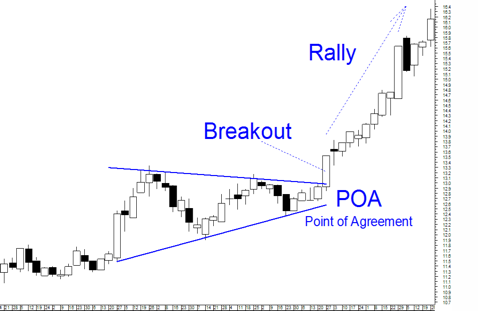
The next chart shows a classic example of this happening. The market winds in towards a point of agreement but then suddenly breaks out and rallies. Of course it is the rally that we want to trade. But it is the point of agreement that we need to identify in order to prepare for the ensuing rally. This is called breakout trading and it is a method of trading that will provide some opportunities when trend trading opportunities are scarce.

Figure 3 - Rally following a Point of Agreement
Periods of consolidation often mean trading opportunities dry up. But if we are patient and mindful of market dynamics it is possible to use the consolidation as an opportunity in itself. After all, as I have explained here, a point of agreement signals a high potential for a forthcoming rally.
Whilst we know a breakout will probably occur, it is not possible to determine the direction of the breakout or the length of the rally. For this reason it is necessary to wait for the breakout to occur before entering and to monitor the trade with sound risk and money management. All together, breakout trading is a useful trading strategy to have at your finger tips.
To read more on this topic please visit www.alanhull.com where there is free online course available about breakout trading.