- Active Investing - what is it?
- All Weather Trading Plan using Complex Theory (Parts 1 - 4)
- Asset Management (Parts 1 - 4)
- Back Testing
- Breaking out from consolidation
- Breakout trading in all market conditions
- Charting in a Nutshell
- Children of the Bear
- Fibonacci and the Golden Ratio
- Going Public
- Hull Moving Average
- MACD Breakout Trading (Parts 1 - 2)
- Making decisions with a Simple Moving Average
- Probability: do you have the stomach for it?
- Profit Taking
- Relative Strength
- Record Keeping
- Risky Business
- Short Selling
- Social Media Bubble
- Switching Gears
- Rate of Return indicator
- Time and Money
- Tools of the Trade
- Trade Warrants (Parts 1 - 4)
- Trading without spending money
- Trendlines
- Triangles
- GMMA's on Weekly Charts
- Writing Custom Indicators
Articles include:
Pattern recognition is the oldest form of technical analysis used to study financial markets. The majority of patterns that chartists search for amongst price charts usually indicate a 'Point of Agreement' (POA). POAs occur when market participants refrain from either buying or selling. Buyers want to buy shares below fair value and sellers want to sell shares at a profit. They are both reluctant to act when they believe the market is at fair value. Markets never remain at fair value for prolonged periods of time with the price breaking out in either an upward or downward direction. Depending on the type of pattern being observed the chartist will decide on the most probable direction that the price will move in when it breaks out of the 'Point of Agreement'.
Triangles are one of the most common patterns that occur in charts. Triangles are a pattern that indicates a 'Point of Agreement' with the shape of the triangle indicating the probable direction of the forthcoming breakout.
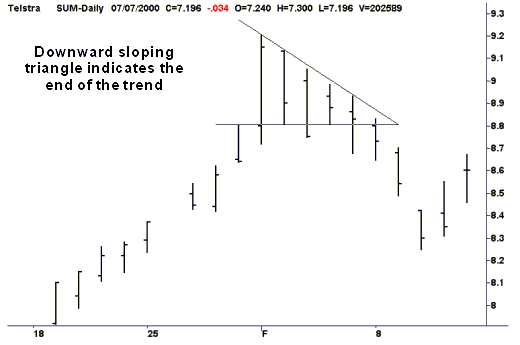
A downward sloping triangle indicates a likely downward breakout at or near the point where the hypotenuse meets the bottom. Each time the bulls attempt to move the price away from a particular level the bears bring it back. Each time this occurs there are less and less bulls. When there are no bulls left a downward breakout usually occurs.

In late 1998 and early 1999 Telstra's share price enjoyed a meteoric rise that lasted from October 1998 to the beginning of February 1999. The downward sloping triangle gave the earliest warning that the trend was about to end. Note how the price was unable to break away from the $8.80 level. As the market began to run out of Bulls the price made a series of lower highs. The tip of the triangle is a 'Point of Agreement' and from this point the Bears took control of the market and drove the price downwards. Triangle patterns can usually be spotted before the tip has occurred making them very useful patterns for Traders.
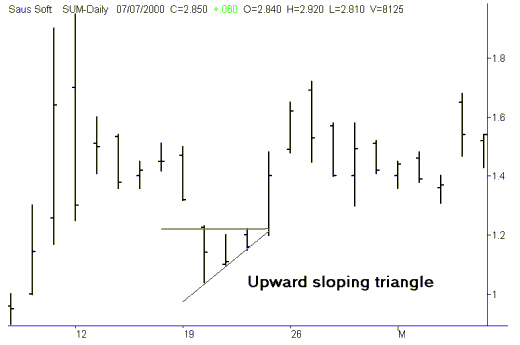
An upward sloping triangle indicates a likely upward breakout at or near the point where the hypotenuse meets the top. Each time the bears attempt to move the price away from a particular price level the bulls bring it back. Each time this occurs there are less and less bears. When there are no bears left an upward breakout occurs.

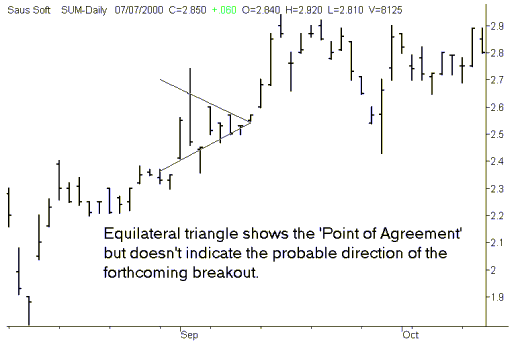
An Equilateral triangle gives no indication as to the direction of the forthcoming breakout but does indicate a point of market agreement and hence a breakout. Market sentiment is not dominant in either direction.
