- Active Investing - what is it?
- All Weather Trading Plan using Complex Theory (Parts 1 - 4)
- Asset Management (Parts 1 - 4)
- Back Testing
- Breaking out from consolidation
- Breakout trading in all market conditions
- Charting in a Nutshell
- Children of the Bear
- Fibonacci and the Golden Ratio
- Going Public
- Hull Moving Average
- MACD Breakout Trading (Parts 1 - 2)
- Making decisions with a Simple Moving Average
- Probability: do you have the stomach for it?
- Profit Taking
- Relative Strength
- Record Keeping
- Risky Business
- Short Selling
- Social Media Bubble
- Switching Gears
- Rate of Return indicator
- Time and Money
- Tools of the Trade
- Trade Warrants (Parts 1 - 4)
- Trading without spending money
- Trendlines
- Triangles
- GMMA's on Weekly Charts
- Writing Custom Indicators
Articles include:
Technical Analysis existed long before the advent of personal computers. Prior to the use of PCs a chartist would use pencil, ruler and graph paper to create price charts. One of the earliest indicators in use was the crossover indicator created by overlaying a fast moving average with a slow moving average. When the fast moving average crossed upwards through the slow moving average it indicated a buy signal. Similarly, when it crossed down through the slow moving average a sell signal was generated. The following chart illustrates this technique using a 9 day simple moving average (Fast SMA) with a 21 day simple moving average (Slow SMA).
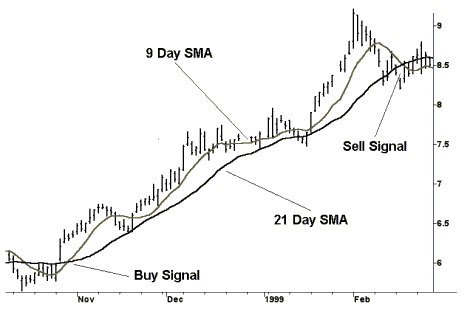
By today's standards this indicator is considered simplistic in design but half a century ago it would have taken hours of tedious calculations and careful construction. It is no wonder that indicators such as the very popular MACD have only come about since the use of computer aided drawing. As a result of this technologically driven evolution, technical analysis is still in its pioneering stages with the body of knowledge, including new indicators, growing at an exponential rate. The good news is that the playing field is level for all of us that possess a PC, Charting Software and the need for an indicator that hasn't been invented yet. The 'Need' being the key ingredient to creating a good indicator and not the ability to drive a computer. Although it doesn't hurt if you have a passion for mathematics, Boolean logic and computers in general.
My father is a veteran of the Poseidon era and was doing in the 1960's what is commonly referred to as a Price/Volume breakout search. In those days they used the trading summary printed in the daily newspapers and cross-correlated shares that were on the 'Best Performers' list with shares that were on the 'Highest Turnover' list. Shares that appeared on both lists were enjoying a bout of positive sentiment. These shares warranted closer examination, as they were ideal trading candidates.
We can take the need to locate shares with a large increase in price and a corresponding large increase in volume as a basis for building an indicator. The making of a good indicator always starts with a good sentence, which doesn't look or sound anything like a mathematical formula.
I want to locate shares that have risen sharply in price and volume on the same day.
It clearly defines our need but now we have to make it more quantitative. (i.e. introduce values)
I want to locate shares that have risen at least 10% in price and 100% in volume on the same day.
Computers only think in black and white. They can only answer questions with 'Yes/No', 'Pass/Fail' or 'Accept/Reject'. They do this by using conditional statements that contain the words 'If' and 'Then'. We have to convert our sentence to a conditional statement that the computer can understand. (Note that we are still using the Queen's English).
If the price has risen at least 10% and the volume has risen at least 100% then display the share code.
Unfortunately computers don't understand English and we now have to start talking their language. Most charting programs use words such as Close, Volume and mathematical symbols like > that means Greater than or < which means Less than. Our sentence is beginning to evolve into a Boolean logic statement that can be understood by a computer.
If the price rise is > 10% and the rise in volume is > 100% then display the share code.
It's now time to replace phrases such as 'The price rise is' with a mathematical expression. The price rise refers to the difference between today's price and yesterdays price and it's a similar situation for the rise in volume. The equivalent mathematical expression for price would be:
(Today's Close - Yesterdays Close)/Yesterdays Close > 0.1
Note that 10% has been expressed as a fraction being 10/100 which equals 0.1. The rise in price has also been expressed as a fraction by dividing the difference between today's price and yesterdays price by yesterdays price. Transposing the mathematical expressions into our sentence we get the Boolean logic statement that can be used by a computer to fulfill our need.
If (Today's Close - Yesterdays Close)/Yesterdays Close > 0.1 and (Today's Volume - Yesterdays Volume)/Yesterdays Volume > 1 then display the share code.
This Boolean logic statement is universal and can now be adapted for use in any charting program that can run custom indicators and perform searches or explorations. We now come to the fork in the road where the Metastock users go to the left and the Supercharts users go to the right. Being a Supercharts man I will go to the right showing how to convert this Boolean logic statement into a search indicator and how to use the ChartScanner Function. Next Time!
To create a custom indicator using Supercharts click on the Tools pull-down menu at the top of the screen. Select Quick Editor... from the list and the following box should appear.
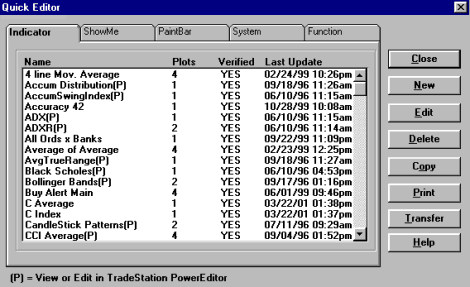
Select New and you will be asked for a name for your new indicator. Type Price/Vol. Breakout and click on OK. The following box should now appear on the screen.
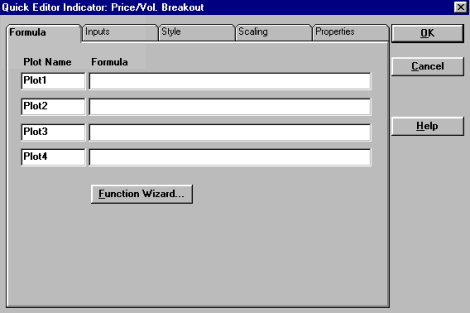
To plug our universal statement into Supercharts we must equate each part of our expression with equivalent expressions that Supercharts will understand. (Look in 'Function Wizard...')
| Our Expression | Supercharts Equivalent |
| Today's Close | close |
| Yesterday's Close | close[1] |
| Today's Volume | volume |
| Yesterday's Volume | volume[1] |
| And | and |
| Display the share code | Return a value of '1' otherwise return a value of '0' |
Supercharts 'If/Then' Conditional Statement
IFF(COND,TVALUE,FVALUE)Where:
COND is the condition that will return a 'True' or 'False' result.
TVALUE is the value returned by the plot if the condition is true.
FVALUE is the value returned by the plot if the condition is false.
Transposing the Supercharts equivalents into our Boolean logic statement we get:
IFF((close-close[1])/close[1] > 0.1 and (volume-volume[1])/volume[1] > 1,1,0)
One problem that will cause our indicator to misbehave is if Volume[1] = 0 or close[1] = 0. If either of these conditions occur then we will generate a Divide by Zero error. To prevent this from happening we can use another conditional statement that will turn our indicator Off if Volume[1] = 0 or close[1] = 0. This conditional statement surrounds our original indicator & returns a value of 0 if Volume[1] = 0 or close[1] = 0. Type the following line into Plot1.
IFF(volume[1] = 0 or close[1] = 0 , 0 , IFF((close-close[1])/close[1] > 0.1 and (volume-volume[1])/volume[1] > 1,1,0) )
Now select the Properties tab and the following box should appear on the screen.
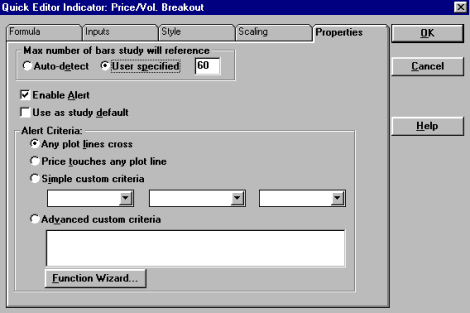
Under Max. number of bars study will reference select the Auto-detect radio button. Make sure that the Enable Alert box is ticked and click on the Advanced custom criteria radio button. A cursor will appear in the box underneath and we can type in our alert criteria of Plot1=1. After typing in our alert criteria we can select OK and the following box will appear.
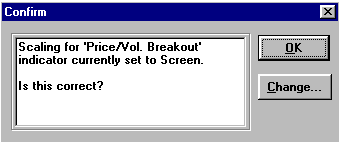
Click on OK and you will be returned to the Quick Editor box. Our new indicator will now appear in the list of indicators as Price/Vol. Breakout and be marked as Yes under Verified.
Our Indicator will now appear in the Analysis Techniques list and we can call up a chart and apply it. Solution 6 rose from approximately 70 cents to $18.00 during 1999/2000. It clearly had positive sentiment and would make a good test case for our Price/Volume breakout indicator.
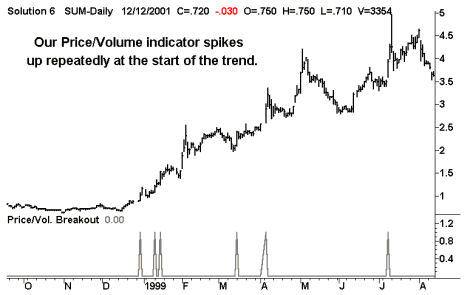
The above chart shows our indicator generating a series of spikes during the early days of Solution 6's meteoric rise. Notice that as the trend progressed there was far less spikes being generated. Our indicator would have given us repeated warnings that Solution 6 was experiencing positive sentiment. This indicator will point us in the direction of shares that are likely to become the next Solution 6. We can also adjust our indicator to suit changing market conditions. If the market slows we can search for a 5% rise in price and 50% rise in volume. Alternatively, if the general confidence in the market improves, we can move our criteria in the opposite direction. This is done by using the Edit function in Quick Editor. We can now use our indicator to perform automated searches of the entire Stockmarket.
The Price/Volume breakout indicator returns a value of 1 if a share price has risen 10% or more and volume has risen at least 100%. We have set the alert to activate when Plot1=1. We now have to apply this indicator to every chart using the ChartScanner function available under the Tools pulldown menu at the top of the screen.
The bad news is that the ChartScanner can only analyse charts within previously saved workspaces, which means that we must setup our workspaces first. We will need 2 workspaces that will be named Search A-K and Search L-Z. The first step is to create a workspace called Search A-K and this is done by selecting New Workspace... which is available under the File pulldown menu. After you have typed in the name you want for the workspace and pressed OK, select the Chart (Shift+F2) radio button and press OK again.
Data Vendors in Australia supply Metastock data for use with Supercharts and shares are stored in alphabetically labeled directories (JustData's BodhiGold software lets you choose the directory structure you require). When creating a new chart, a box similar to the one below should appear.
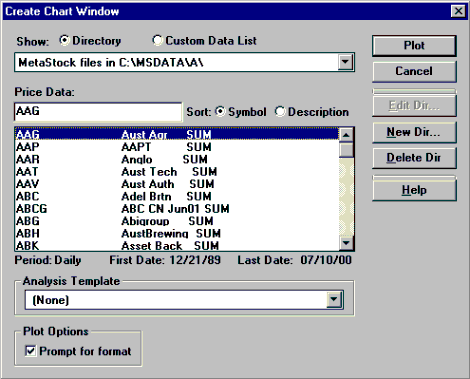
Choose any share listed under the A directory and press Plot. When the next box appears choose either Daily or Weekly compression and press OK. Note that daily compression is the default setting for Supercharts and all of our charts must have the same compression setting.
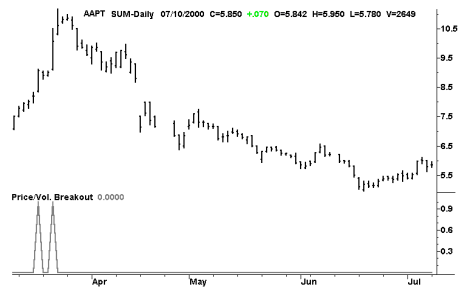
If you selected Daily compression then a daily bar chart for the share you selected should now appear on the screen. Note the workspace name at the top of the screen should read Search A-K. Go to the Analysis Techniques list and select our Price/Vol. Breakout indicator. You should now have a screen that looks similar to the one below. Notice that this chart shows our indicator generating spikes when the AAPT's share price was trending upwards in mid March.
You now have to repeat this process using a share from each alphabetical directory. This workspace will only hold shares from the A to K directories. Create a new workspace called Search L-Z and repeat the process for shares from the L to Z directories. Ensure that every chart window includes our indicator. After you have created all of the charts in both workspaces they must be saved using the Save Workspace function listed under the File pulldown menu. ChartScanner will only work with workspaces that have been saved. Now select the ChartScanner function listed under the Tools pulldown menu. The ChartScanner box should now appear on the screen. All Types must appear in the window at the top of the box.
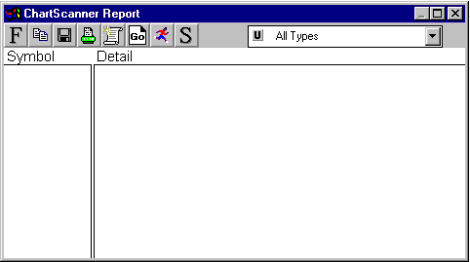
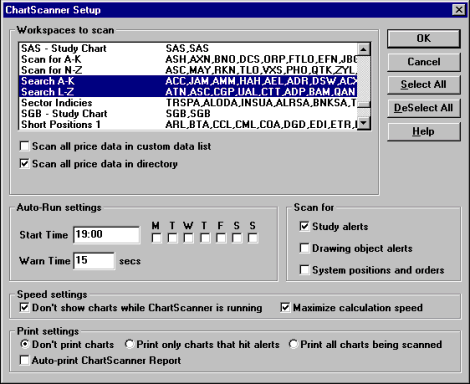
Select the S icon situated at the top of the box and the setup box will appear on the screen.
-
Using the example above as a guide, perform the following steps.
- Only highlight the 2 workspaces named Search A-K & Search L-Z.
- Tick the box for Scan all price data in directory.
- Under Scan for, tick the box for Study alerts.
- Duplicate the other settings shown in the above example.
Once this task is completed press OK and you will be returned to the ChartScanner Box. Select the icon with the running man wearing the red top & blue pants and the following box will appear.
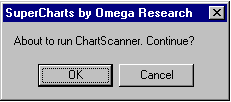
Press OK and Supercharts will start scanning through all of the charts in our workspaces and all of the other charts in the same directories. Each chart will be checked against our indicator and Supercharts will generate a list of every chart that activates an alert. This process will take approximately 5 to 10 minutes and you will not be able to use your computer during this time. It is also a good idea to make sure that you do not have any other applications open when ChartScanner is running.
When the search is completed the ChartScanner box will re-appear with a list of all the shares that activated an alert. The box can now be made smaller by placing the mouse at any corner of the box and dragging the corner diagonally inwards. With our ChartScanner box reduced in size and moved to a corner of the screen we can start Eyeballing the results.
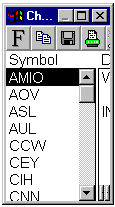
To go to a share on our list simply place the cursor on the share symbol and double click the left hand mouse button. The chart that activated the alert will appear on the screen. If an alert box appears and an audible alarm sounds simply press OK and the box will disappear.
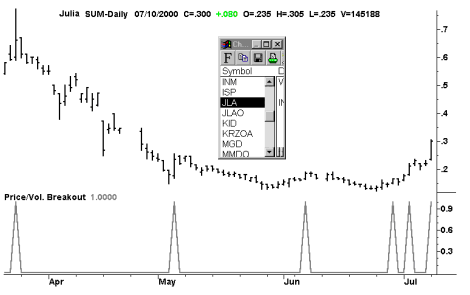
Be very careful not to alter the chart as the alterations will be kept by the workspace and will affect future searches. To avoid altering the Search workspaces it is a good idea to note down shares of interest so they can be called up in another workspace for closer examination. Julia Mines Limited has been picked up by the search and has tripped the search indicator several times in recent days. Other indicators can be added to each chart in both workspaces and the ChartScanner function will scan every share using all of the applied indicators. The golden rule is to Keep it Simple and never lose sight of the Need that you started with.
So far in this article we have performed an automated search of the entire Stockmarket using our Price/Volume Breakout Indicator. This search returned a list of shares that had risen 10% or more in price and 100% or more in volume during the same day. This list is comparable to the fish caught in a commercial fisherman's net. We now have to manually sort through our catch to separate out the unwanted seaweed and inedible types of fish.
The easiest way to start is by ignoring Exchange Traded Warrants; Company issued options and any other derivatives. Our search criteria is designed for ordinary shares, and derivative products that enjoy increased leverage represent unwanted seaweed. Only investigate symbols with 3 alphabetical characters as shown in the list below and ignore any other symbols.
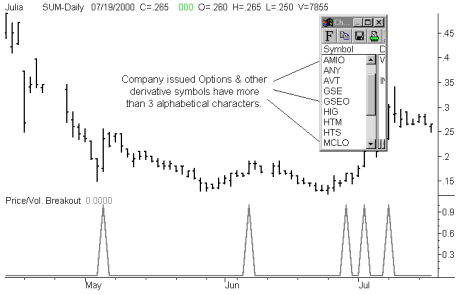
The next step in our elimination process is to examine the liquidity of the shares on our short list. An inactive share with a very low price and very few sellers in the market will rise rapidly in price and volume if an irrationally enthusiastic buyer comes along. If you examine the liquidity or money flow of such shares you will discover that it only takes a small volume of shares to be traded in order for them to get caught in our net. Although a fish, they are an inedible type.
Shares with poor liquidity or money flow are not good trading opportunities. When you attempt to enter the market and purchase $5,000 worth of shares you will probably create a Price/Volume breakout of your very own. Showing up on your own Price/Volume breakout searches is not recommended. There are other problems associated with trading inactive shares such as the inability to exit the market at your predetermined stop loss level. The best method is to examine the money flow during a single day to determine whether or not the share is a trading possibility. This is done by multiplying the volume of shares traded during a single day by the median or average price of the same day. The following formula is used to perform this calculation.
Money Flow = Volume x (high+low)/2
A good yardstick is to ensure that the daily money flow is at least 10 times greater than the position size that you wish to buy. The following chart is indicative of a share with poor liquidity.
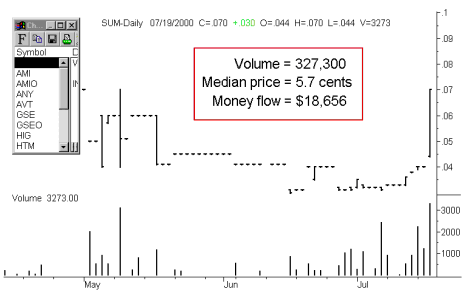
The above share has a money flow of $18,656 on a good day! Also note that the share price doesn't move for several days at a time. The following chart shows a share with good liquidity. This share turned over $784,492 on the day it was caught in our net and the price is running.
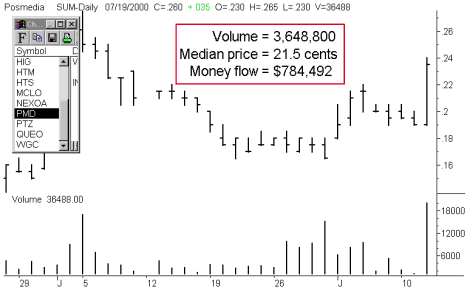
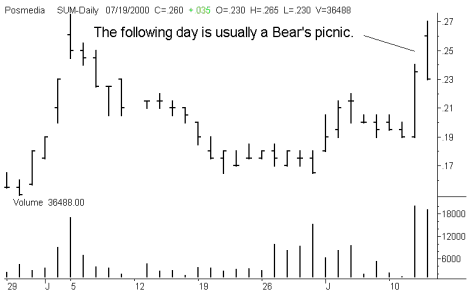
Posmedia has good liquidity and a share price that is beginning to trend up from its recent low at 17.5 cents. It is a potential trading opportunity that has to be watched daily for a possible entry. Remember never to use a Price/Volume Breakout indicator as a Buy Indicator. Behind every commercial fishing Trawler there lurks a group of sharks and behind every rally there lurks a group of profit takers. Our irrationally enthusiastic buyer, formerly yours truly, has turned up again and bought on the breakout signal. Note in the following chart how the market opens higher the next day but closes down on the previous day as the bears take control of the market.
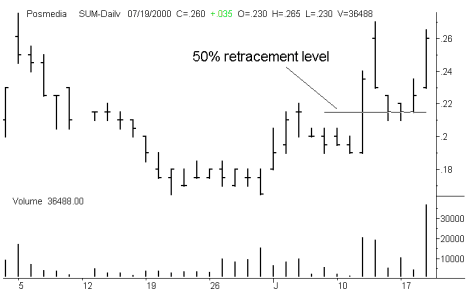
On the balance of probability it pays to anticipate the retracement. If the price doesn't retrace then you can tell your friends about the one that got away. The following chart shows how the price retraced to the 50% retracement level and found support. It then began to rise, signaling an entry.
We can conclude that our custom indicator can catch fish and hence legitimise our original Need. Writing custom indicators is both fun and challenging but if it is to be profitable it must be a process that is based on meeting our needs and not just a desire to invent.