- Active Investing - what is it?
- All Weather Trading Plan using Complex Theory (Parts 1 - 4)
- Asset Management (Parts 1 - 4)
- Back Testing
- Breaking out from consolidation
- Breakout trading in all market conditions
- Charting in a Nutshell
- Children of the Bear
- Fibonacci and the Golden Ratio
- Going Public
- Hull Moving Average
- MACD Breakout Trading (Parts 1 - 2)
- Making decisions with a Simple Moving Average
- Probability: do you have the stomach for it?
- Profit Taking
- Relative Strength
- Record Keeping
- Risky Business
- Short Selling
- Social Media Bubble
- Switching Gears
- Rate of Return indicator
- Time and Money
- Tools of the Trade
- Trade Warrants (Parts 1 - 4)
- Trading without spending money
- Trendlines
- Triangles
- GMMA's on Weekly Charts
- Writing Custom Indicators
Articles include:
Profit taking is an aspect of share trading that receives little to no attention by most market experts. You will be hard pressed to find any written material on the subject. But there is good reason for this high degree of neglect... profit taking is completely unnecessary.
Chris Tate makes the point in his book, The Art of Trading by inference when he states that most of the time professional traders sell shares because their stop losses have been hit. Profit taking is not the most common way in which market professionals exit the market. By market professionals I mean individual market participants and not institutional investors who are forced to take profits in order to maintain declared portfolio weighting's. (Remember all those Pie charts that Financial Advisors are always showing prospective clients). It is absolutely normal for a trader to buy a share at $6.00, watch it go as high as $10.00 and then sell it when it hits the stop loss at $8.00. The following chart illustrates a typical trade from entry to exit.
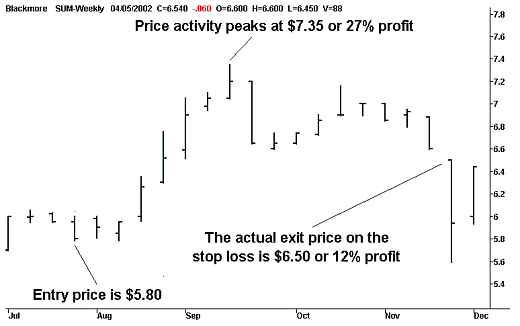
The above example is from a Live Trading Night I held on the 25th of July 2000 and the stop loss method employed at the time was Daryl Guppy's Count Back Line. There is absolutely no denying that a 27% profit in only 6 to 7 weeks is a lot more attractive than a 12% profit in 16 weeks. But to compare apples with apples we should convert these profits to annual returns.
- 27% in 6 to 7 weeks equates to an annual rate of return of 27% x (52/6.5) = 216%
- 12% in 16 weeks equates to an annual rate of return of 12% x (52/16) = 39%
Is it any wonder that some of us are loathed to sit on our hands and do nothing if it means giving back to the market a whopping 177% per annum in profits. (216% - 39% = 177%) But there is a very real danger that we will choke the trend with our 'Profit taking' technique and this a very serious threat to the tried and true philosophy of 'Cut your losses and let your profits run'. (What's more... there is absolutely nothing wrong with 39% per annum.) So as a Trend Trader, I must be very careful as to the design of any profit taking method. But before we start looking at new and exciting ways to Take the money and run, be advised that all of the following strategies have their strengths and weaknesses and there is no single superior method or Holy Grail when it comes to profit taking.
Also note that I am not professing to have listed every known profit taking technique in this single chronicle. Most notably I have excluded pattern recognition techniques, as a thorough narration of these would fill a small book. Another point of interest is that any number of the following techniques can be combined. So it pays to decide on an overall profit taking strategy, if you choose to adopt one, and incorporate it into your complete set of trading rules. (Remember... if it can't be expressed as a rule then it isn't part of your trading system.)
Arbitrary
The simplest method that we can employ is to take profits on an arbitrary basis. I include in virtually all of my writings on Active Investing, a Blue Chip share trading technique, that I personally elect to take profits if a position exceeds 10% per month or more. The following chart of Blackmore shows the result of employing this method.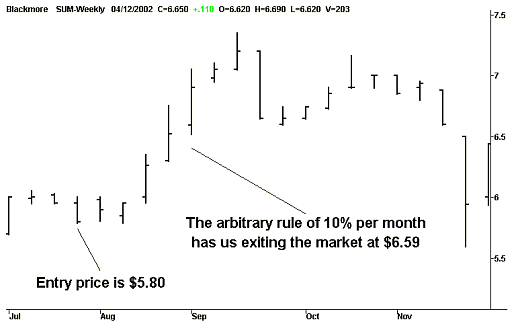
This approach doesn't get us out at the uppermost peak of the price activity but, as you will see, it is an efficient method when assessed in terms of 'Annual rate of return'. Speaking of which the annual rate of return that we have achieved with this method is 177%. When setting an arbitrary benchmark for profit taking, ensure that it is at least double your trading objectives.
10% per month = 120% per year which is more than twice my aim of 20 to 50% per annum.
Rally
We are now entering the realm of behavioural techniques that are designed to work in harmony with the nature of the market. A rally is defined as a rising week where the closing price is higher than the opening price of the same week and also higher than the closing price of the previous week. It is unusual for price activity to rally for four weeks in a row and very unlikely for it to rally for five weeks in a row. It therefore makes sense to take the money and run after the market has rallied for four straight weeks. The following chart shows our exit after 4 weeks of rallying.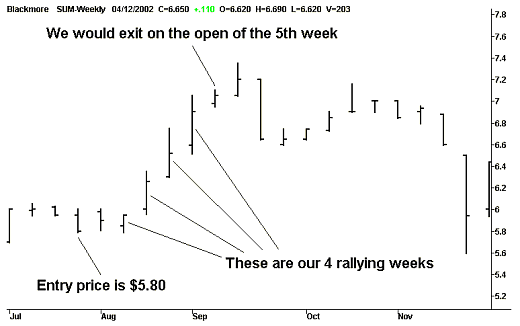
Our exit price after five weeks is $6.97, resulting in an annual rate of return of 210%. Although this method gets us out of the market closer to the peak of $7.35, it is still somewhat arbitrary in nature, as we have elected to take our leave of the market after 4 weeks of rallying. From the above example you can clearly see that we would have gotten away with 5 weeks of continuous rallying before we elected to exit the market. But note that this would have resulted in an exit price of $7.05 after six weeks, which is an annual rate of return of only 187%, albeit for 1 week longer.
Although we would have enjoyed a rising trend for an extra week, you have to question if it would be worth the inherent risk. The risk being that we delay our departure a little too long and get caught out by a very bad falling week, as occurred on the seventh week in the above example of Blackmore. Price activity finally reversed... falling from an opening price of $7.20 to a closing price of $6.65. In terms of lost profits we have, in the course of just one week, given back 39% of our total profits to the market. Greed can be expensive.
Reversal
Whilst waiting for a price reversal in a market rally doesn't always work, as Blackmore clearly demonstrates, it does eliminate any reliance on the use of arbitrary benchmarks. The benchmark of taking profits at the start of the fifth week of a rally for example must be determined by backtesting, which basically means that it will always be subject to change with respect to any changes in broad market conditions. In other words... rallies are more sustainable in Bull markets than they are in Bear markets and this phenomenon will cause our benchmark to shift.But, by waiting for a market reversal, where the closing price is lower than either the opening price of the same week or the closing price of the previous week, we avoid having to Tweak our technique as market conditions change. In other words if we wait for a price reversal then we are simply waiting to witness the presence of other Profit-takers in the market before we profit-take as well. Whilst this approach would have proven fairly expensive in the case of Blackmore, it is a perfectly valid behavioural method that will prove successful on the balance of outcomes. Looking at a profitable example of the reversal technique... the price reversal that occurs on the sixth week of the rally in CSL, fairly accurately defines the highest peak in price activity.
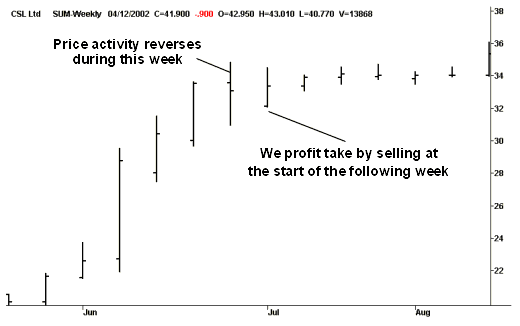
Taking profit on market reversals generally works best with non-volatile shares that aren't inclined to fall dramatically in a short space of time. But there is a way that we can Leave the market with the last of the Buyers rather than Wait for the first of the Sellers, which is exactly what we are doing if we wait for a price reversal to occur before we take action.
Money Flow
In order to witness the departure of The last of the Buyers we must turn our attention to the volume of shares being traded each week or, more accurately, to the value of shares being traded each week. The value of shares being traded each week, also known as the weekly money flow, is calculated by multiplying the number of shares traded for any given week by the average price for the same week. (where Average Price equals the average of the high and the low prices for the given period.)Money Flow = Volume x Average Price
Money flow can be visually represented on a price chart by a Histogram in exactly the same way as volume is. My book, Charting in a Nutshell - 2nd Edition describes the Money Histogram in detail and includes the custom indicator formula for constructing it in MetaStock. The following chart of Blackmore includes the Money Histogram. Note how the money flow fades towards the end of the rally... this signals the departure of the last of buyers.
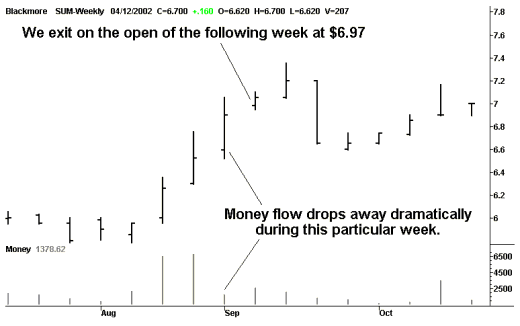
Money flow usually increases at the start of a price rally and decreases at the end of a price rally, providing us with a very handy, pro-active exit signal for profit taking. Our money flow exit strategy, when applied to Blackmore (as shown above), translates into an annual rate of return of 210% which is probably the best result we can ever hope to achieve in the case of this particular rally. Please note however that the Money Flow technique should always be used in conjunction with the Reversal method as a price reversal should never be ignored in favour of Money flow. In other words... you should exit the market on either signal.
Whilst profit taking techniques are always questionable with respect to their probable benefit over more conventional trailing stop loss methods, they do allow individuals to Tailor make their market exit strategies to suit their personal psychological profiles. On a personal note... I'm the lazy type who is perfectly happy to ride the prevailing trend and move one step back with every two steps forward. But if it irks you or causes you sleepless nights to see existing profits evaporate then you can employ a profit taking technique to snatch the money off the table before the marketplace takes it back. The downside is that you will have to work harder than those of us who are less prone to sleepless nights, counting money instead of sheep.
A final but very important point is that your market strategy should never have to rely on profit-taking in order to work. If this is the case then I would seriously question the stop loss method being used as a necessary part of its function is to lock in profits. Whilst I am not an avid exponent of active profit taking, I would never entertain a market strategy that didn't incorporate some type of 'Trailing' stop loss. Now there's a thought... isn't a trailing stop loss in fact a type of profit protection method or passive profit taking technique?