- China Trading Statistics
- Darvas Trading
- GMMA Breakout Behaviour
- Happy Easter Holiday
- Holiday Trade Management
- Managing Profitable Trades
- Measuring Returns
- News and Profits
- Placing the CBL Stop
- Recovery made in China
- Secrets of Gold
- The difference between trading
and investing - Trade Exit
- Trading Briefs
- Trading Halt
- Trading IPO's
- Trading Psychology - Getting Perspective
- Using a Private Index
- Using Effective ATR Stops
- Using Equivolume
Articles include:
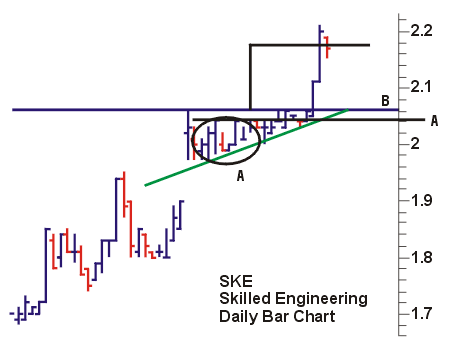
During the week we were alerted to this interesting chart. This is a classic example of an upward sloping triangle with a very fast breakout that reaches its target within a few days. Not all traders are interested in these short term trades, but in current market conditions they provide a way to reduce the risk of time in the market. In nervous markets, time becomes a significant risk factor. Nervousness can result from the global political situation, or, as many traders have discovered, from an uneasy earnings reporting season.
Finding stocks with strong chart patterns calls for lots of eyeball work. Most times traders find these patterns when they are looking at something else. The stock has attracted their attention for some other reason. It may be on a recommended list, it may turn up on a exploration list, it may be a stock we are already interested in because of its sector, its industry, or newspaper reports. We generally find these stocks with strong chart patterns by secondary means because there is no reliable search for chart patterns.
SKE provides at least two types of trading opportunity. The first is a longer term trend trade. This may be why it attracted our interest in the first place. The second opportunity is the shorter term triangle breakout trade. The chart shows how this trade developed.
The success of this trade does not depend on recognizing the triangle in area A. This trade can be very profitable when identified anytime in the seven days prior to the eventual breakout. Triangle patterns in particular do not rest on early recognition. Traders can wait until they are confident the pattern exists before they take a position.
Aggressive traders take a position before the triangle is completed. The main risk is that the pattern will fail to develop and they will need to exit the trade on a stop loss, and perhaps with a small loss. Conservative traders wait for the breakout to take place before they buy. Their risk is that they miss out on a substantial part of the upward move and so reduce their profits. They can overcome this to some extent by using a contingent buy order. In this example they would instruct the broker to buy as soon as there was a trade at $2.07.
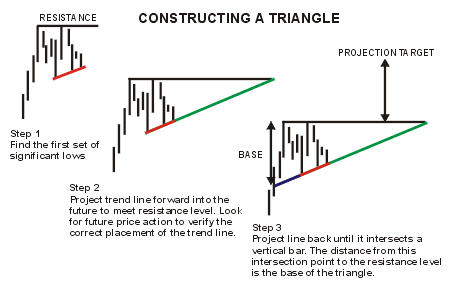
Identifying these chart patterns is not always straightforward and the SKE chart shows some of the problems. The diagram shows the way we usually go about identifying a triangle pattern. We start with the resistance level, then project the trend line.

The first problem with SKE is the resistance level. Should it be placed at line A or line B? Initially it is placed at line A because this is where the bulk of upwards price action pauses.
Plotting the upward sloping trend line is easier, but when we project it back it does not actually intersect a price bar. Instead in intersects a price gap. This is not really a problem. We simply project the first bar in the pattern downwards. This is shown by the thick black line. The base, or height of the triangle is measured from this point. Using this calculation we can project the target for this trade. It is only 6.93% based on an entry at $2.02. We may decide that this is not enough to make the trade worthwhile.
In this example the trader would continue to watch SKE because the spike high of the first bar can also provide a resistance level. This is shown as line B. As price action develops in the last 5 days of this pattern, line B does act as a resistance level. This changes the projected profits targets and the potential return. Based on a an entry at $2.04 this is now a 6.86% return. Traders may still decide that this return is not enough to justify taking the trade.
The key point is that traders must use the most recent information to adjust their initial analysis as appropriate. With the information available in area A it was appropriate to set the resistance level - the top of the triangle pattern - at line A. As price action develops, it became more appropriate to set the resistance level at line B. Traders who entered into the trade in area A were able to lift their projected targets and their profits to a 7.92% return. Traders who did not discover this pattern until two or three days before the eventual breakout had no hesitation in using line B as the top of the triangle.
Based on these adjusted calculations, the target for the trade is $2.18. It is achieved within 2 days of the triangle breakout, and depending on the entry point, delivered between 6.86% and 7.92% return. The breakout was very successful in that it exceeded the price projection target. Traders who had a sell order in place were immediately filled. Even traders who waited were able to get an exit at their preferred price on the next day. This high probability pattern delivered the goods.
A feature of this trade which is increasingly common in the current market is the way the breakout was delayed until the pattern was almost completed. This is typical of a bearish market environment.
When time is a significant risk factor, these high probability short term trades are an effective way of managing risk and grabbing profits.
|
INDICATOR REVISION => UP SLOPING TRIANGLES The up sloping triangle is formed when a horizontal resistance line is intersected by a rising trend line. Price rise to the resistance level, where sustained selling forces the price back. Buyers can bid less and still pick up stock. However, on each pullback, the fall is reduced. Buyers have to bid slightly higher to get the stock. This creates the rising trend line as each new low is higher than the previous one. When there are no more sellers at the resistance level buyers have to bid higher to get stock. Often this means bidding substantially higher and the breakout takes place. This is a strong chart pattern and breakouts from the last third of the triangle can be very powerful.
|
