- China Trading Statistics
- Darvas Trading
- GMMA Breakout Behaviour
- Happy Easter Holiday
- Holiday Trade Management
- Managing Profitable Trades
- Measuring Returns
- News and Profits
- Placing the CBL Stop
- Recovery made in China
- Secrets of Gold
- The difference between trading
and investing - Trade Exit
- Trading Briefs
- Trading Halt
- Trading IPO's
- Trading Psychology - Getting Perspective
- Using a Private Index
- Using Effective ATR Stops
- Using Equivolume
Articles include:
You probably heard it on the news late Wednesday. You most certainly found it hard to avoid hearing the news on Thursday morning before the market opened. Bob Mansfield, Telstra Chairman, had resigned. This clearly signalled a trading opportunity as the market reacted to this news. High profile resignations, or appointments are well publicised and they excite the imagination and emotion of the crowd. We use the TLS event as an example of how traders can assess and manage these trading opportunities. It is too late for readers to apply these strategies to TLS but remember the purpose of the newsletter is to explore, educate and teach the techniques of successful trading using contemporary examples.
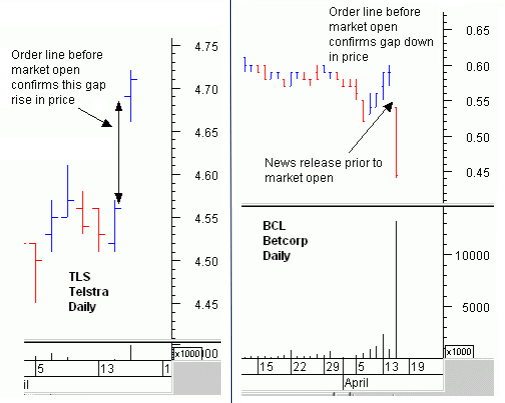
Which way would the Telstra price jump? We all have ideas about this, but this does not mean our analysis is correct. Trading is not about being right. It is about being profitable. Although some commentators were forecasting a price drop, the people who were prepared to back their opinions with money had an entirely different idea. The most effective way to answer this question was to look at the order lines in the minutes prior to the open. The result is clearly shown on the daily chart with an opening gap of $4.69 compared to the previous close of $4.56. Compare this reaction with the news driven reaction to the BCL announcement of 'a substantial decline' in performance released half an hour before the open of trading.

The order line shows what side of the market we should be on. In this case it is a bullish order line. How do traders best take advantage of this clear bullish sentiment? There are two approaches. The first is to simply trade TLS. This approach has a significant disadvantage. Although the price jump appears quite dramatic it is not so useful in percentage terms. Unless we purchased TLS before the announcement, the tradeable price rise is from the low of Thursday to the high of Thursday - 1.29%. It is not from the close of Wednesday to the high of Thursday - 2.85%. If traders believe the impact of Mansfield's resignation is likely to continue then the jump in price is treated as the beginning of a longer-term trend. The second approach is to treat this as a short-term move and attempt to make the most of any price leverage available. This is achieved through the use of derivative instruments such as warrants or options.
Traders turn to trend analysis tools to make a decision about the likely nature of the up move created by the resignation. There is a single key question. Does this have the potential to change the direction of the existing trend? The answer starts with an analysis of the current trend direction. There is no need to get too complicated with this.
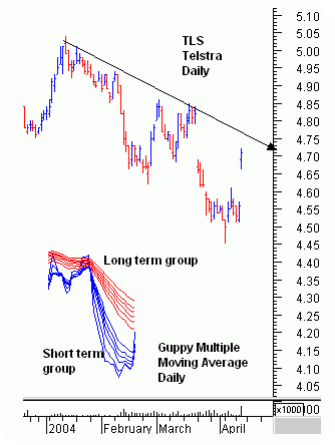
Eyeball the chart. Resist the temptation to see a downtrend as an opportunity to buy cheap before a new up trend commences. This is a powerful temptation, particularly if we are already tempted by the opportunity we think our analysis has revealed. Many people simply ignore the reality of the chart. The trend shown on the chart looks to be moving down. This observation is confirmed with a straight edge trend line, plotted as shown.
Downtrend's do change, and sometimes they change very rapidly. This happens when a particularly significant event occurs, such as an attack on another country, a terrorist threat, or other significant breaking news. The second task for the trader is to assess the probability of a change in the trend. An eyeball examination of the chart suggests that it requires quite a large price jump to lift prices above the trend line. It is only when prices close above the trend line that the probability of a trend change increases. Price moves that lift prices to the trend line are not a signal for a trend change because in a downtrend the line acts as a resistance point. Price must move above this line and stay above it for a trend change to take place.

Another way to assess the probability of a trend change is to apply a Guppy Multiple Moving Average analysis. The important relationship here is set by the long-term group of averages. The direction, and in particular, the degree of separation, provides important information about the strength of the trend. The news is not good for traders anticipating a powerful trend change. The long-term group of averages is well separated, and this suggests the downtrend is well established. It will take a major event to change the direction of this trend. Evidence of this will be provided by a compression in the long-term group of averages. It is also provided by the ability of the short-term group to compress and move above the long-term group.
On balance, this type of relationship suggests the probability of a trend change is low. This analysis does not say it is impossible. The weight of probability suggests a temporary rise, followed by a resumption of the downtrend in the immediate short term. In a few weeks investors may have changed their mind and we may see a compression in this group and confirmation of a trend reversal. However, this is in the more distant future. The traders focus is on the shorter term probability of behaviour. He draws three related conclusions.
- There is a low probability of a long-term trend change
- The trading opportunity is a 1 to 3 day event before the downtrend resumes
- There is an opportunity to trade the short side of the market using put warrants or options as the initial momentum peaks and the downtrend reasserts itself.
This is a large and relatively slow moving stock. The long up trend from March 2003 to August 2003 delivered around 30% return. Not bad for 7 months, but when this is translated into the possibility for a 2 to 3 day price move, which may be hammered down, the reward fails to compensate for the risk. An entry around the low point of the gap rise, and an exit at around the level of the straight edge trend line delivers a 1.5% return. The way to maximise returns from this news driven event is by using a derivative and the power of leverage. Our derivatives of choice are warrants. The next analysis question is to determine if this theory can be turned into practice.
The market sometimes rewards good analysis. Your analysis may be correct, but as NAB Forex dealers found out, the timing may be quite wrong. TLS may move the way you anticipate, but unless traders select a derivative that also moves fluidly in response to the underlying price movements, the trading strategy will fail. In selecting a derivative we can complete the technical calculations, assembling a collection of Greek symbols or formulas - or we can simply follow the crowd who, having done their homework, are required to buy or sell in a public marketplace.
Our preference is to locate the warrant series with the highest volume in recent days, and to confirm that the volume demand, shown in the order line, remains high. This provides the liquidity for the short-term trading strategy.
The choice is made from 13 listed warrants. Our interest is not in which one we would like to choose, but in the warrant chosen by others. We look for a crowd of active traders. This narrows the choice to just a few. We use TLSWMC as an example because this shows how theory flounders on practice.

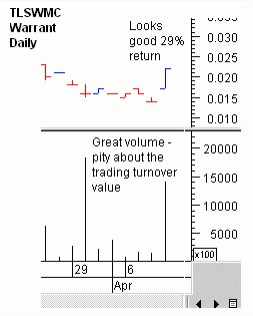
The chart looks very promising. On Thursday the warrant delivered a 29% return from the low of the day to the high of the day. This is the power of leverage at work - but with one significant problem.
On the day prior to the announcement trading turnover was a mere $2,828. On the day of the announcement the 29% return is based on a total turnover of 1,414,823 warrants for a total value of around $24,051. Quite simply, this pool is too shallow for effective trading. To take a position size of $10,000 we need to have at least $50,000 average turnover - and even this is a bare minimum level of liquidity. We need to be able to buy without pushing the price up, and we need to be able to sell without pushing the price down.
Although the prospect of trading a derivative for leverage to take advantage of this news event sounds promising, the reality is that it is suitable for very small trades. Despite the hype, the risk factors in this type of trade does not justify the return available. We think it is worthwhile spending time showing how these types of trading situations are analysed even if it turns out they are a trading failure. These are the analysis steps we followed on Thursday in assessing the opportunities for our own trading. These notes help to create a more realistic understanding of trading activity. The headlines that point to a massive rise in the price of TLS do not translate into a significant trading opportunity. If we understand this we can stop berating ourselves for missing the 'opportunity' and concentrate on more effective trading opportunities where the theory is matched by practical reality. The short-term trading opportunity really exists for those traders who purchased TLS, or TLS warrants prior to the news announcement.
|
TRADERS GLOSSARY - LEVERAGE The second form is based on low price and relies on common misperceptions about value. It does not seem to matter if we pay four cents or five cents for an item, but we are not prepared to pay five dollars when we were quoted four dollars. The percentage difference is the same, but the psychological difference is very large. The result is that low prices move easily while high prices move slowly. This gives low prices a leverage. A third form is another aspect of psychological leverage. When just a few dollars are at stake we can treat the activity as a game. A hand of cards at $1.00 a hand is recreation. A hand of cards at $1,000 a hand is serious business. When we trade the market and commit thousands of dollars we cross the threshold from casual indifference to serious concentration as the cost of entry is leveraged upwards. The threshold level is different for all traders but the impact is the same. Once trading becomes serious we can suffer from trading paralysis. There are other more specific forms of financial leverage involving margin trading and futures margins. |